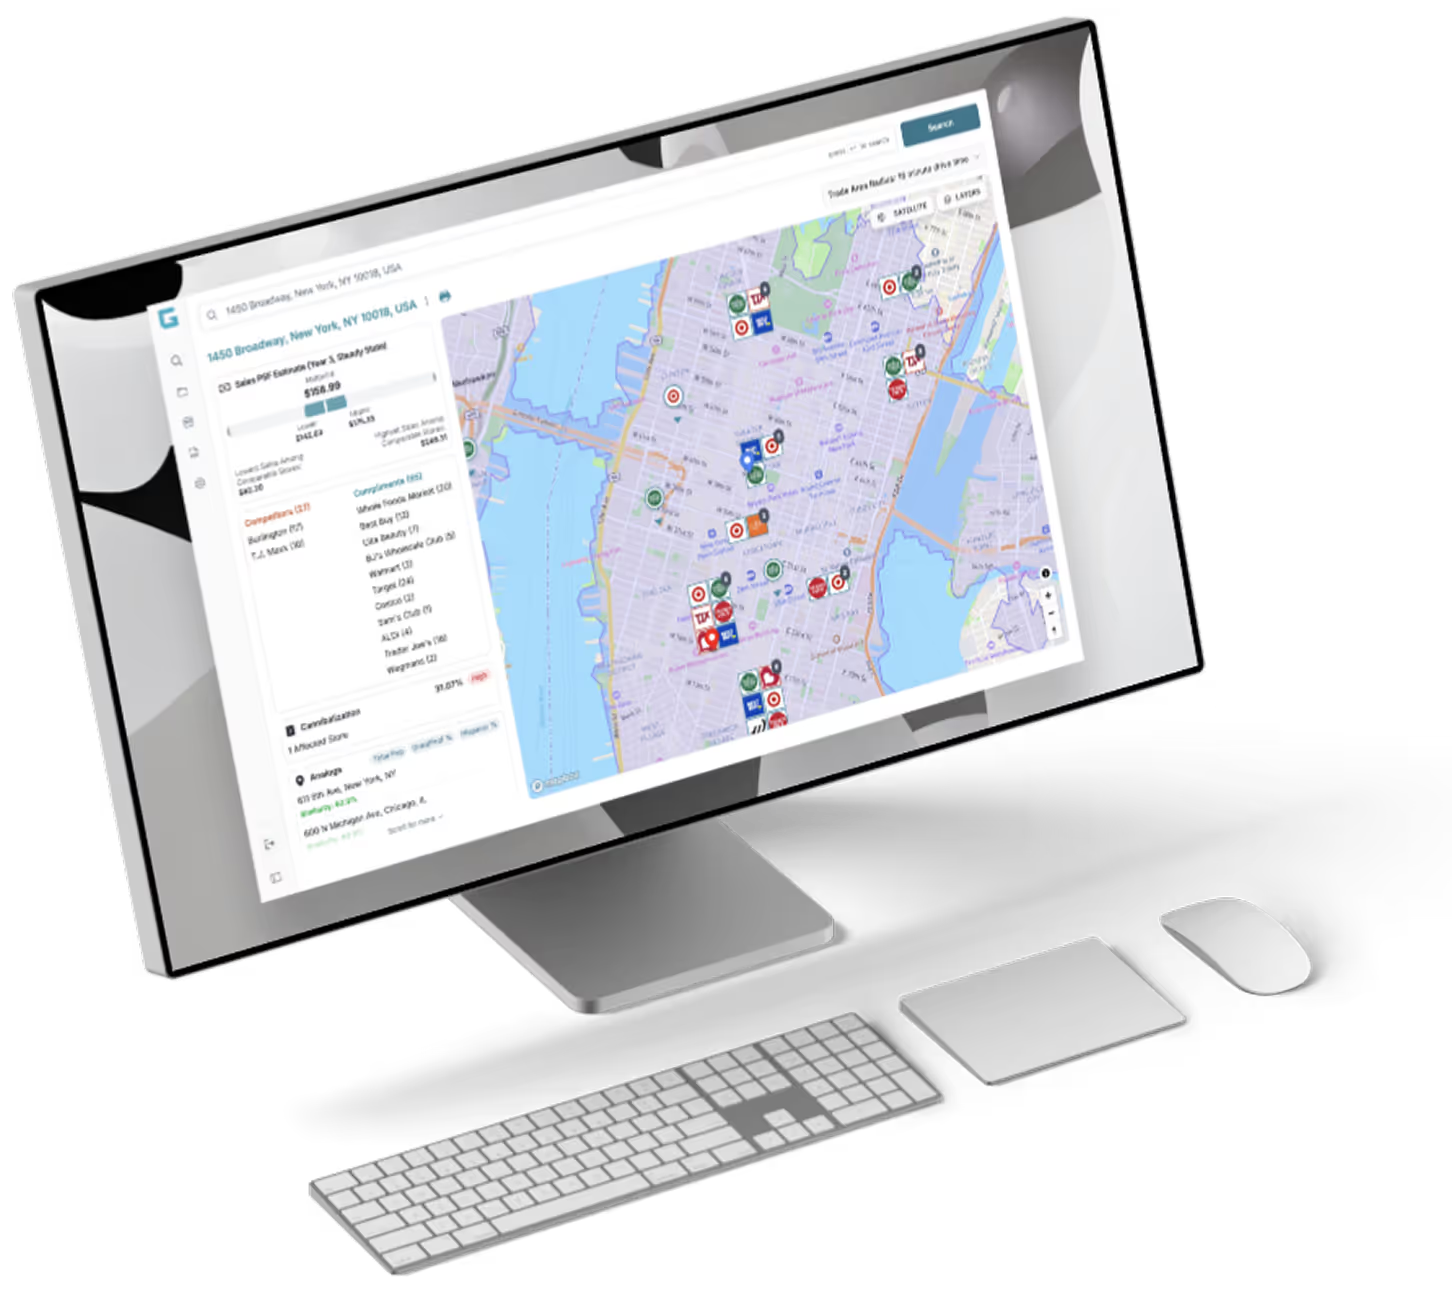
The Platform
Your analyst’s entire workflow. One platform.
Scoring, pipeline, maps, and data—all in one place. No more toggling between ten tabs to assemble a committee deck. Your team spends time analyzing sites, not assembling spreadsheets.
Why Teams Switch
What changes when you stop assembling data
4,500+ sites analyzed in the last 6 months. Teams evaluating more opportunities, faster—and walking into committee with numbers they can actually defend.
25 hrs
saved per analyst, per week
10+
tools replaced with one platform
Different. In a Good Way.
Committee-ready output
Every site comes with explainable scores, trade area analysis, and competitive context. Walk in prepared, not scrambling.
Trained on your portfolio
Scoring models built on your best locations, your demographics, your performance data—not generic industry benchmarks.
Live in a day. No seat limits.
No 6-month implementation. No per-seat fees. Your whole team gets full access from day one.
Site Selection Made Simple
Location Research That Actually Helps
Foot Traffic Made Simple
Spot the winners before signing the lease. Real foot traffic patterns at your fingertips—compare across locations, time periods, and days of the week.
Compare Real Performance, Not Promises
See exactly how competitors and complementary businesses rank nationally. Benchmark foot traffic against existing locations to predict performance.
...and everything else for accurate site intelligence.
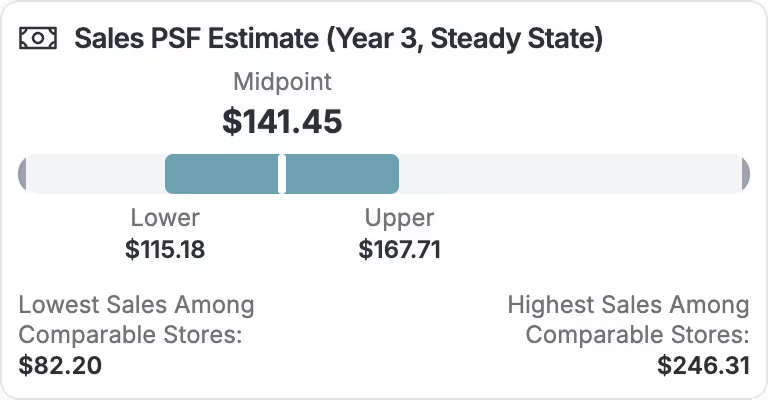
Sales Forecasting
Custom-tailored ML projections based on your brand’s actual performance, not generic industry models.
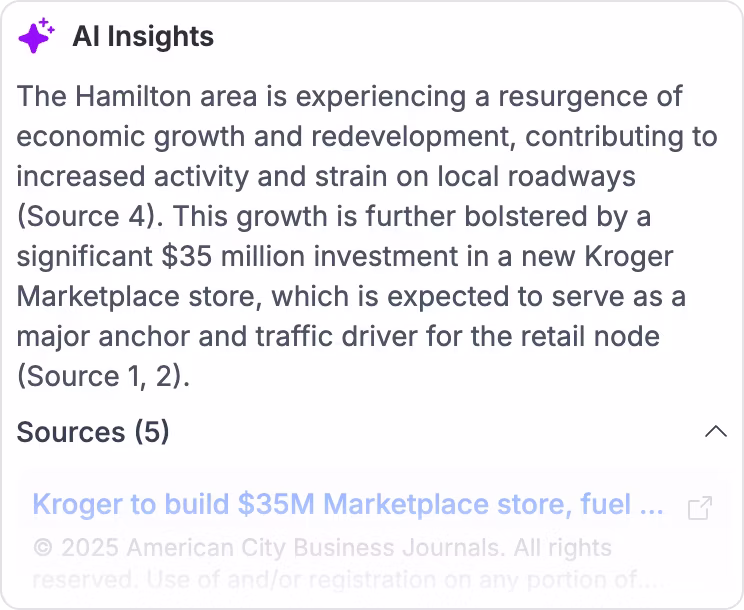
AI Insights
Latest developments of the surrounding area, cited with sources for your own investigating.
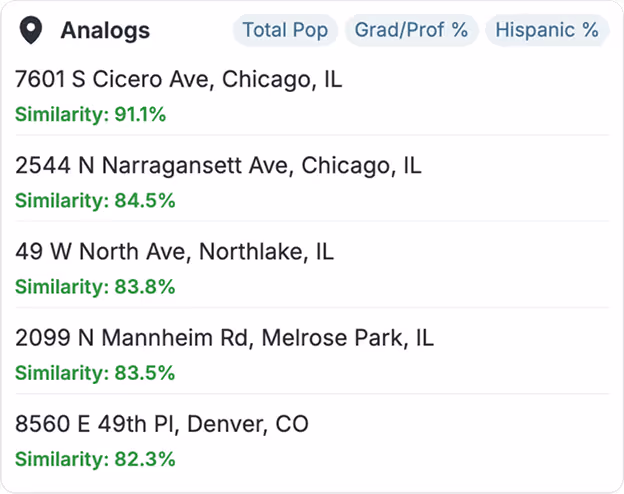
Analogs
Compare the searched location to your existing stores based on your brand’s revenue-driving factors.
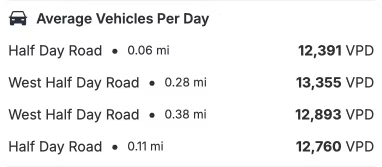
Vehicle Traffic
Daily traffic counts for every adjacent street, displayed on the map and in easy-to-scan lists.
Real results from real customers
Hear Customer StoriesCavender’s Western Wear
3X
expansion rate
27 new stores in 2025, up from 9 the year before.
Books-A-Million
25 hrs
saved per analyst, per week
700 bankruptcy sites evaluated in 72 hours.
TNT Fireworks
10X
more sites to committee
10X typical ROI from just one new location.
“GrowthFactor accelerated our team’s new store site selection process, allowing the team to expedite the review of hundreds of potential sites as part of a complex bankruptcy auction.”

Matthew Furnas
Vice President, Books-A-Million
“GrowthFactor’s understanding of what truly matters in site selection helps us choose sites that meet our operational and customer needs seamlessly.”
Jay Turner
Principal, Preferred Growth Properties

See how it works for your team
We’ll walk through your workflow and show you exactly how GrowthFactor fits.