Retail Site Scoring for Site Selection

GrowthFactor AI Site Scoring
Gut check your gut.
Check your intuition with our science. GrowthFactor scores every site 1-100 based on your brand’s specific DNA, giving you the rigorous data you need to back up your expertise.
Start Scoring ->
User interface showing GrowthFactor Score with overall score 65.6 marked as OK and option for Score Breakdown.

Make decisions based on facts, not just feelings.

The GrowthFactor Score
Custom Calibration
Deal Dashboard Integration
The GrowthFactor Score

The end of "vibes-based" decisions.

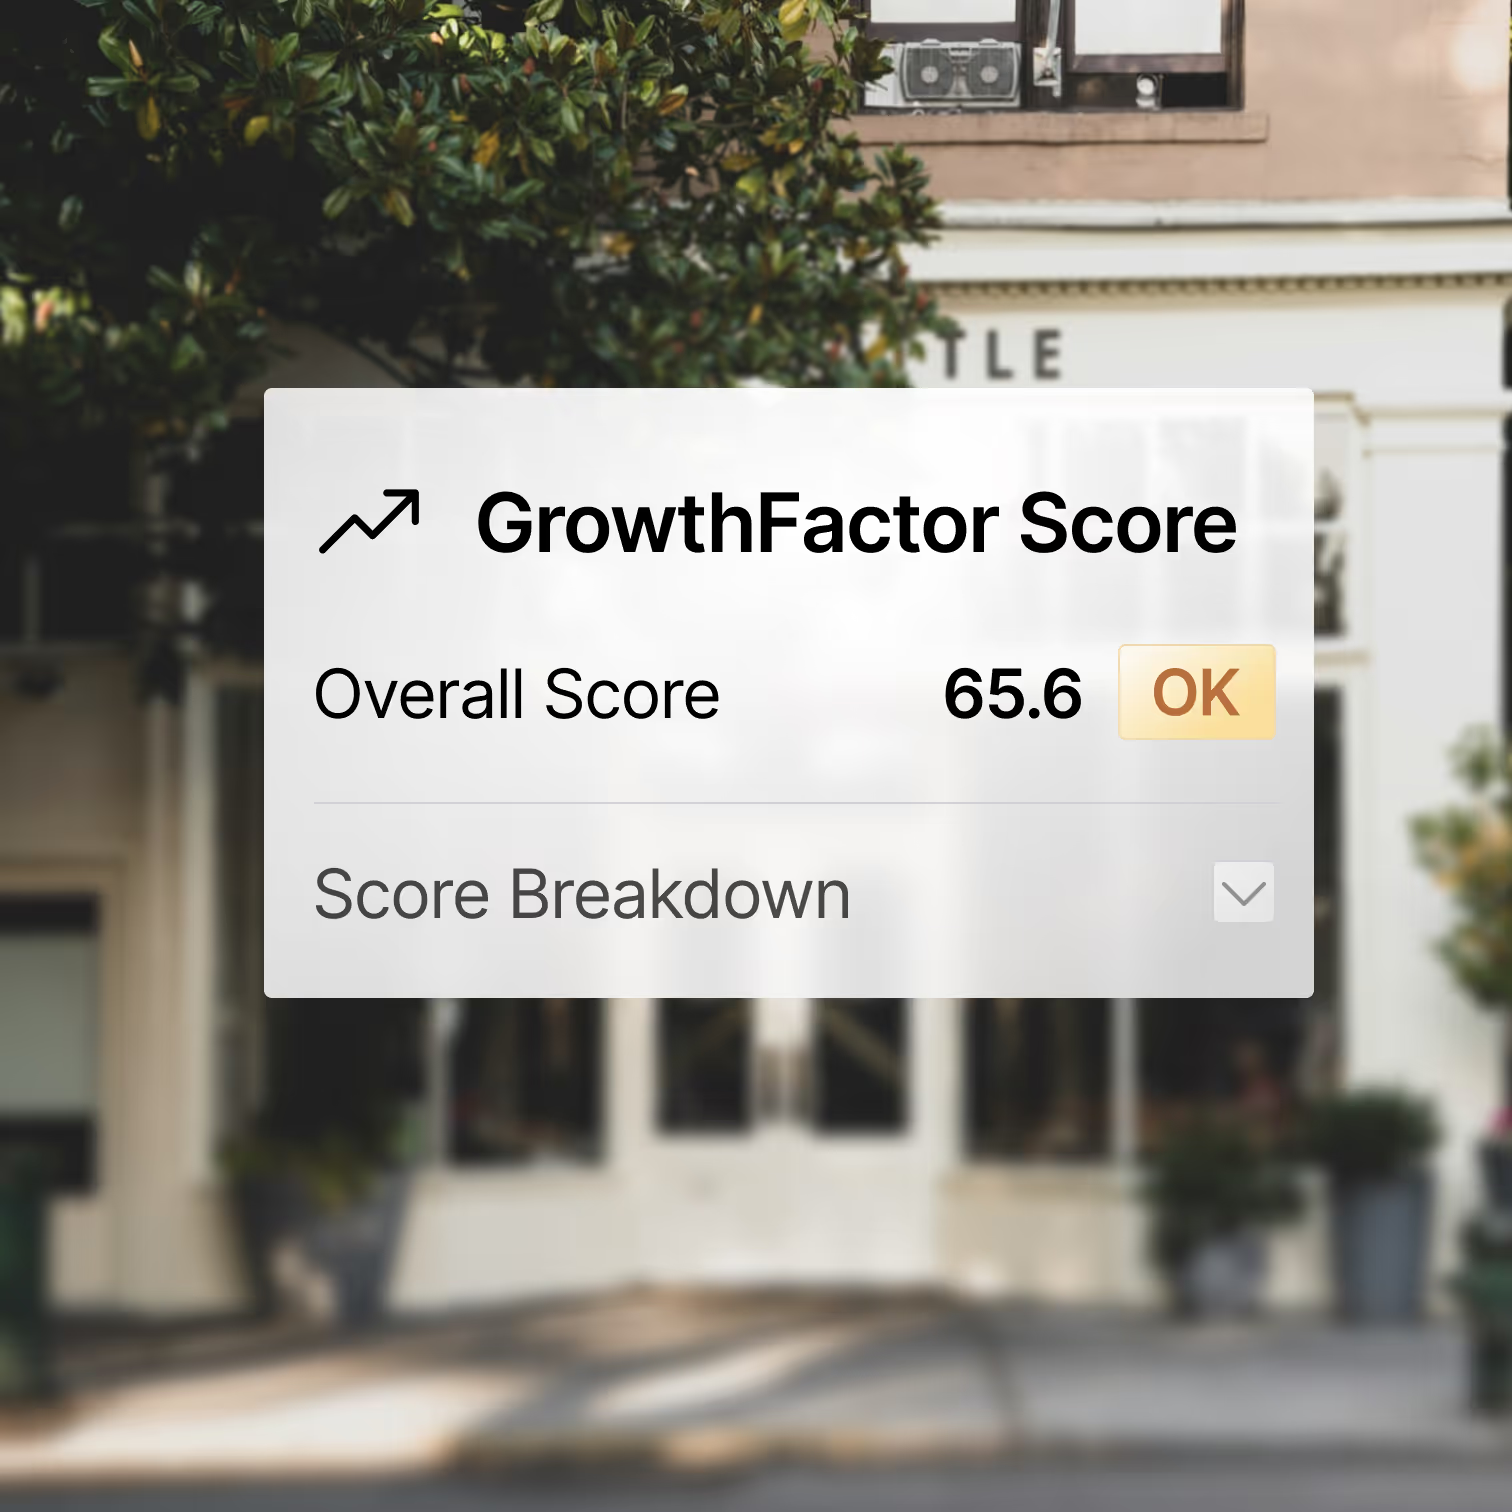
Stop debating over subjective 1-3 scales. Our AI synthesizes foot traffic, demographics, competition data, & more into a single, comprehensive score. It creates a shared language for your real estate committee, ensuring every site is measured against the same "Science."

100%
Consistency in site evaluation across all markets
Lenses Breakdown chart showing scores and ratings: Visibility is Excellent with score 90.0, Demographics Fit is Good with score 75.0, Foot Traffic is Bad with score 35.0, Competition Analysis is Bad with score 50.0, Market Potential is Good with score 78.0.
Custom Calibration

Scale Your Intuition.

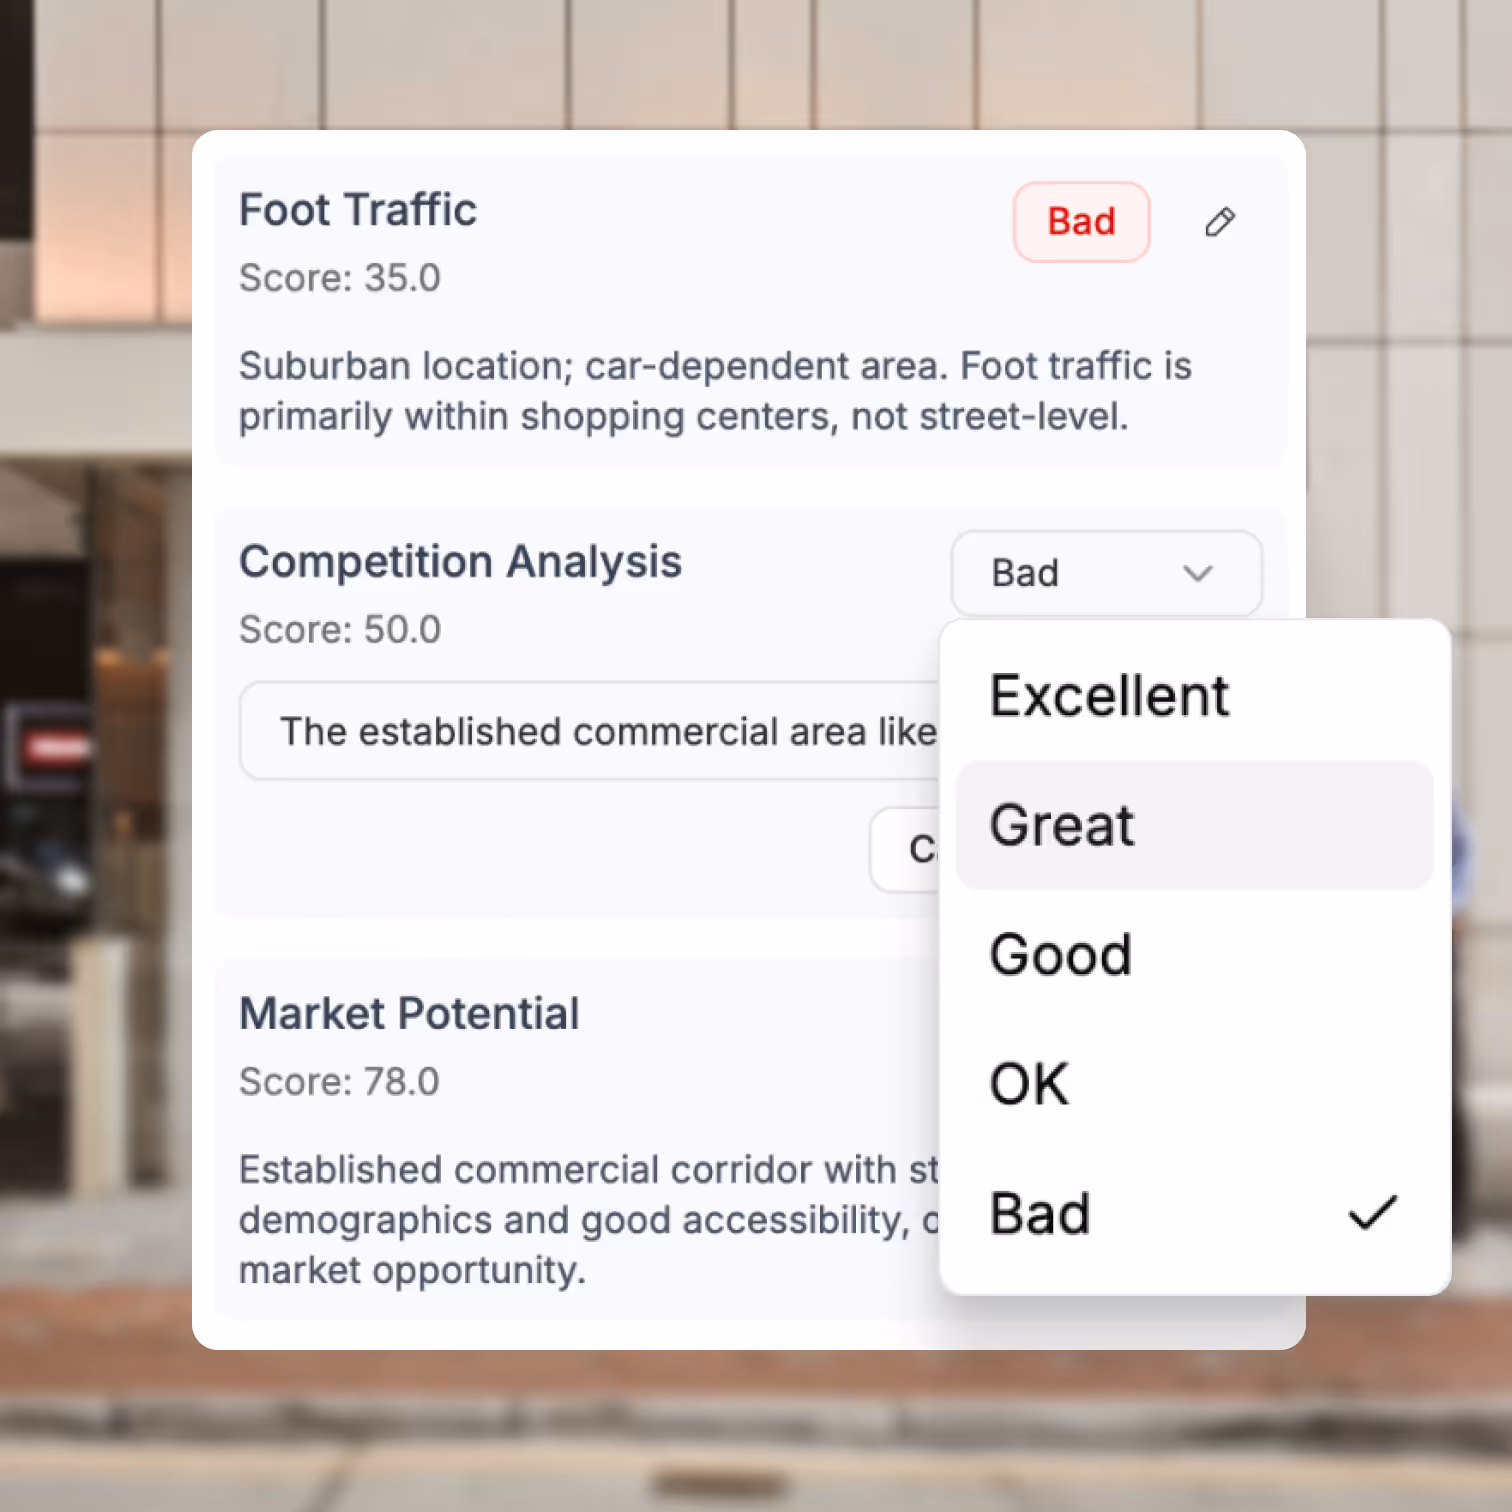
You know your brand’s "Art" better than anyone. The GrowthFactor model isn't a black box— it’s a student. Edit the scoring logic and give feedback to the system. Train the platform to recognize the nuances of your customer profile, so the algorithm evolves alongside your growth strategy.

User interface showing business location analysis with scores for Foot Traffic (35, Bad), Competition Analysis (50, dropdown with options Excellent, Great, Good, OK, Bad), and Market Potential (78).
Deal Dashboard Integration

Know every site cold.

Maintain your credibility when the pressure is on... The scoring engine feeds directly into your Deal Dashboard, allowing you to compare active sites against your historical fleet performance. Eliminate the manual work of "stitching together" data and become the undisputed expert on every trade area.

Zero
"Ugly spreadsheets" required to track deal flow
Deal Dashboard interface showing search results for site deals with locations in St. Louis, MO; Middletown, OH; and West Fargo, ND, each with address, score, and status indicators.
Lenses Breakdown chart showing scores and ratings: Visibility is Excellent with score 90.0, Demographics Fit is Good with score 75.0, Foot Traffic is Bad with score 35.0, Competition Analysis is Bad with score 50.0, Market Potential is Good with score 78.0.User interface showing business location analysis with scores for Foot Traffic (35, Bad), Competition Analysis (50, dropdown with options Excellent, Great, Good, OK, Bad), and Market Potential (78).Deal Dashboard interface showing search results for site deals with locations in St. Louis, MO; Middletown, OH; and West Fargo, ND, each with address, score, and status indicators.

Request Your demo

Schedule meeting

Or submit your information below and we'll be in touch to schedule.

Thank you for your interest! We'll be in touch to schedule soon.
Oops! Something went wrong while submitting the form.

This complimentary session will uncover what's missing and actionable steps to improve your expansion strategy. No obligation, just actionable intelligence you can use right away.

Thank you for testing our service, we'll be in touch shortly!
Oops! Something went wrong while submitting the form. Please try again.