Navigate & Conquer: Making Territory Maps with Google My Maps
Written by: Clyde Christian Anderson
Why Territory Mapping Matters for Growing Retail Chains
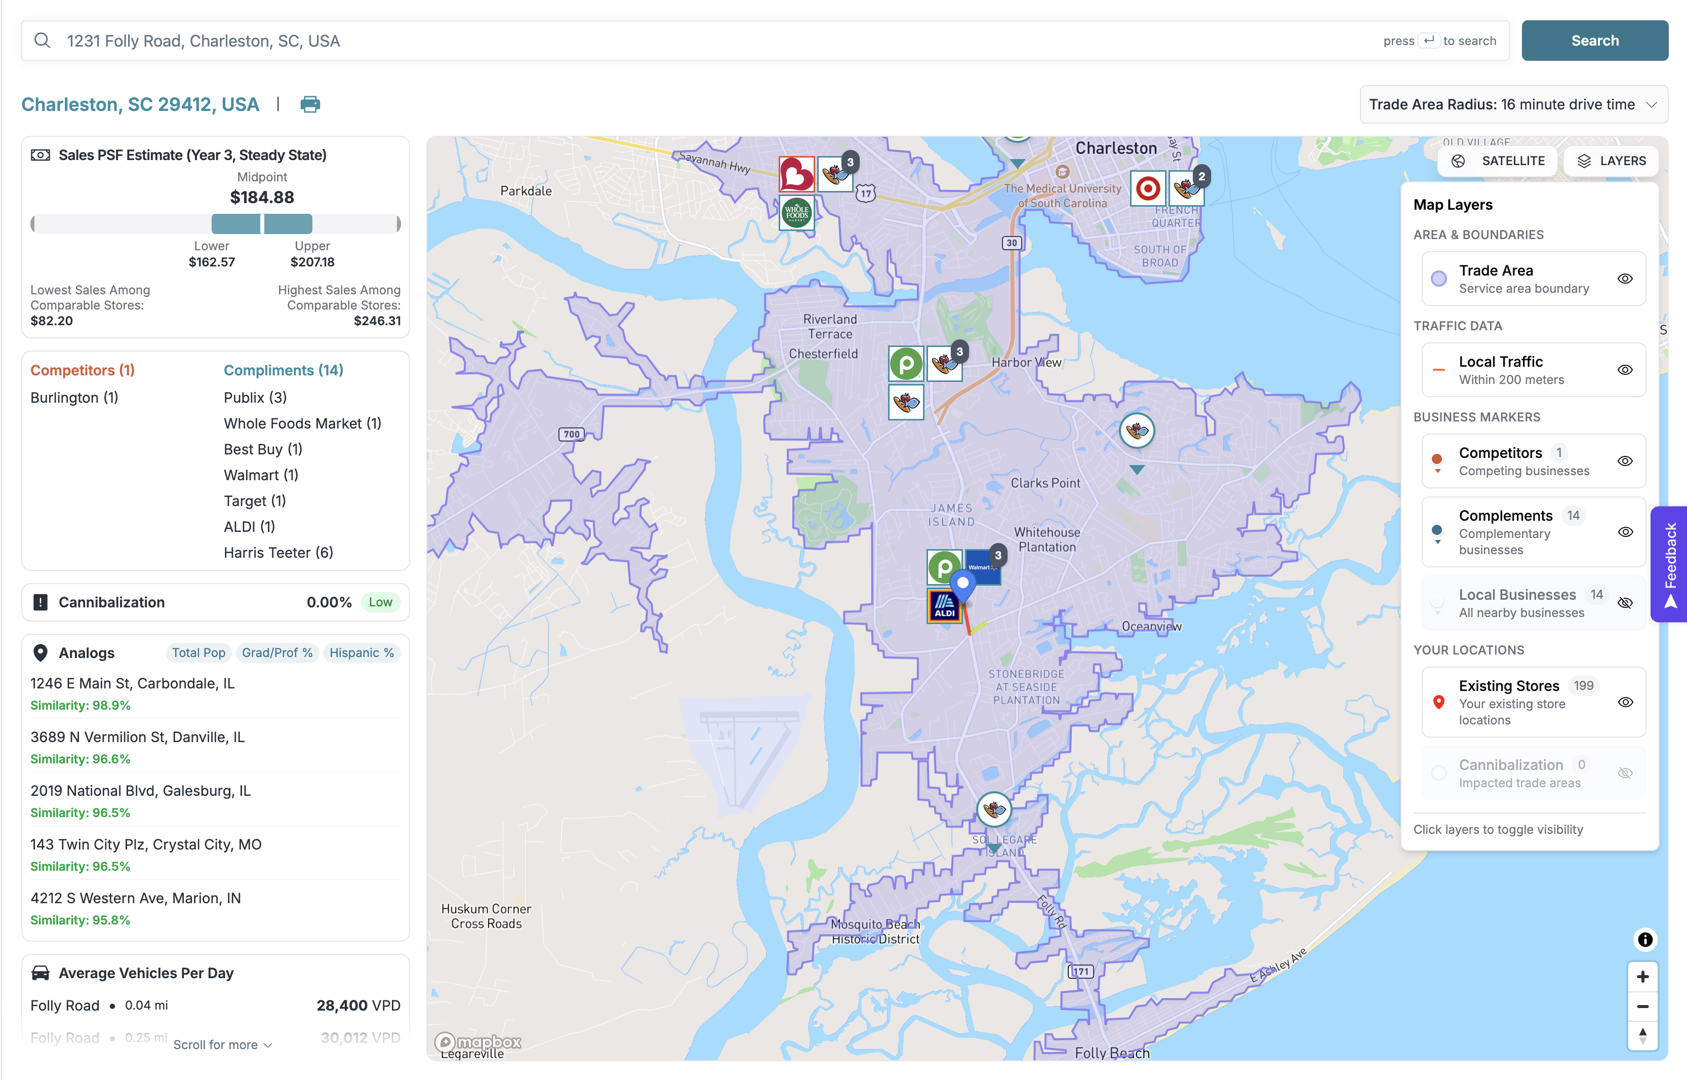
Learning how to create a territory map in Google Maps is a fast way for retail chains to improve sales efficiency and resource allocation. It transforms spreadsheets of addresses into a clear visual story of market coverage, travel efficiency, and territory balance.
You have three main options in Google My Maps:
- Manual Drawing: Use drawing tools to create custom territory boundaries by hand.
- Data Import: Upload a spreadsheet with customer locations or ZIP codes (up to 2,000 rows per layer).
- KML/KMZ Import: Import territory files created in other mapping applications.
A basic map can be made in 15-30 minutes. This visual approach helps you make better decisions about expansion and resource deployment by showing where your customers are, how your sales reps travel, and where market opportunities exist.
While Google My Maps is a powerful and free starting point, it's the first step. For growing retailers managing multiple expansion deals, visual territory mapping is essential for identifying which markets deserve attention.
I'm Clyde Christian Anderson, founder of GrowthFactor. I started in retail at 15 and later moved into real estate site selection, where I struggled to evaluate expansion opportunities with basic tools. That frustration led me to create GrowthFactor, where we help retailers make faster, more confident location decisions.
Getting Started: Manually Drawing Your First Territory Map
To learn how to create a territory map in Google Maps, start with Google My Maps, a free and user-friendly tool. All you need is a Google Account.
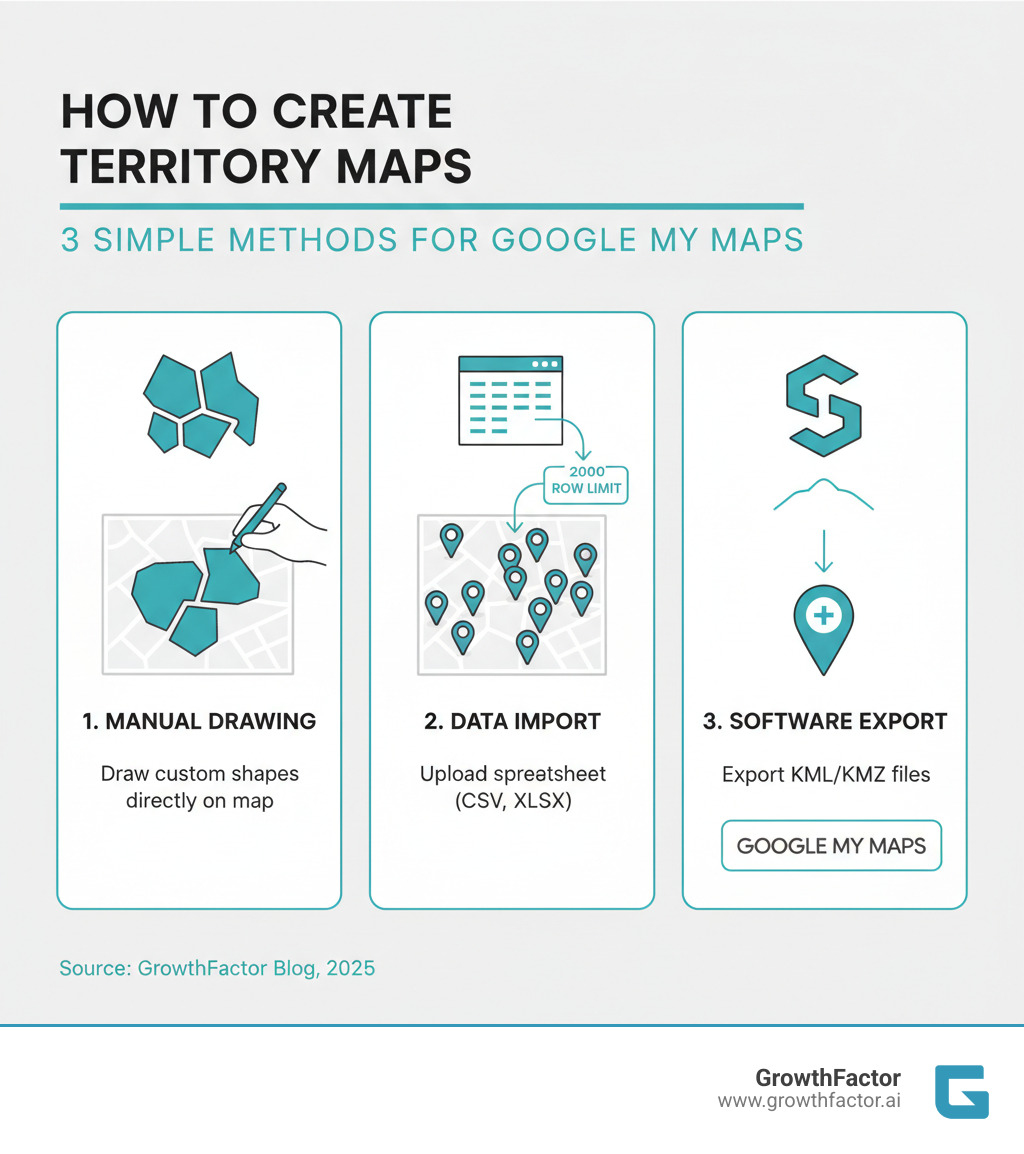
Go to My Maps, click "Create a new map," and give your map a descriptive name. The interface provides simple but effective drawing tools:
- Polygons: Define territory boundaries.
- Lines: Mark routes or borders.
- Markers: Highlight specific locations like customers or stores.
- Ruler: Measure distances to gauge travel time and territory size.
Creating Your First Polygon Territory
To draw a territory, select the "Draw a line" tool. Click on the map to add points that trace your desired boundary. To complete the territory, click on your starting point to close the shape. A window will appear allowing you to name the polygon (e.g., "Northwest Sales Region") and add notes.
Use the paint bucket icon to color-code your territories. For example, assign a different color to each sales rep or use colors to indicate performance (e.g., green for high-performing, red for underperforming). A key best practice is to ensure territories fit together without overlaps or gaps to avoid account confusion and missed opportunities.
Adding Key Locations with Markers
Territories are defined by the locations within them. Use the "Add marker" tool (the map pin icon) to pinpoint customer addresses, competitor stores, or potential new sites.
When you place a marker, you can add a descriptive title (e.g., "Johnson Manufacturing - $75K Annual") and details like account status or last visit date in the description. This turns your map into a functional database.
For greater clarity, customize marker icons and colors. For instance, use blue pins for existing customers, green for prospects, and orange for locations needing follow-up. This visual system allows you to understand your market at a glance, combining colored polygons with categorized markers to tell a clear story.
How to Create a Data-Driven Territory Map in Google Maps
Manually drawing territories is fine for a few locations, but for hundreds of customer addresses or sales data across dozens of ZIP codes, data import is essential. It transforms mapping from a tedious task to an efficient one, populating your map in seconds with high accuracy.
Google My Maps accepts common file formats like CSV, XLSX (Excel), and Google Sheets, so you can use your existing data without reformatting. The main limitation is a cap of 2,000 rows of data per layer. This is usually sufficient for small to mid-sized retail operations, but larger datasets require more robust tools.
Preparing Your Spreadsheet for Import
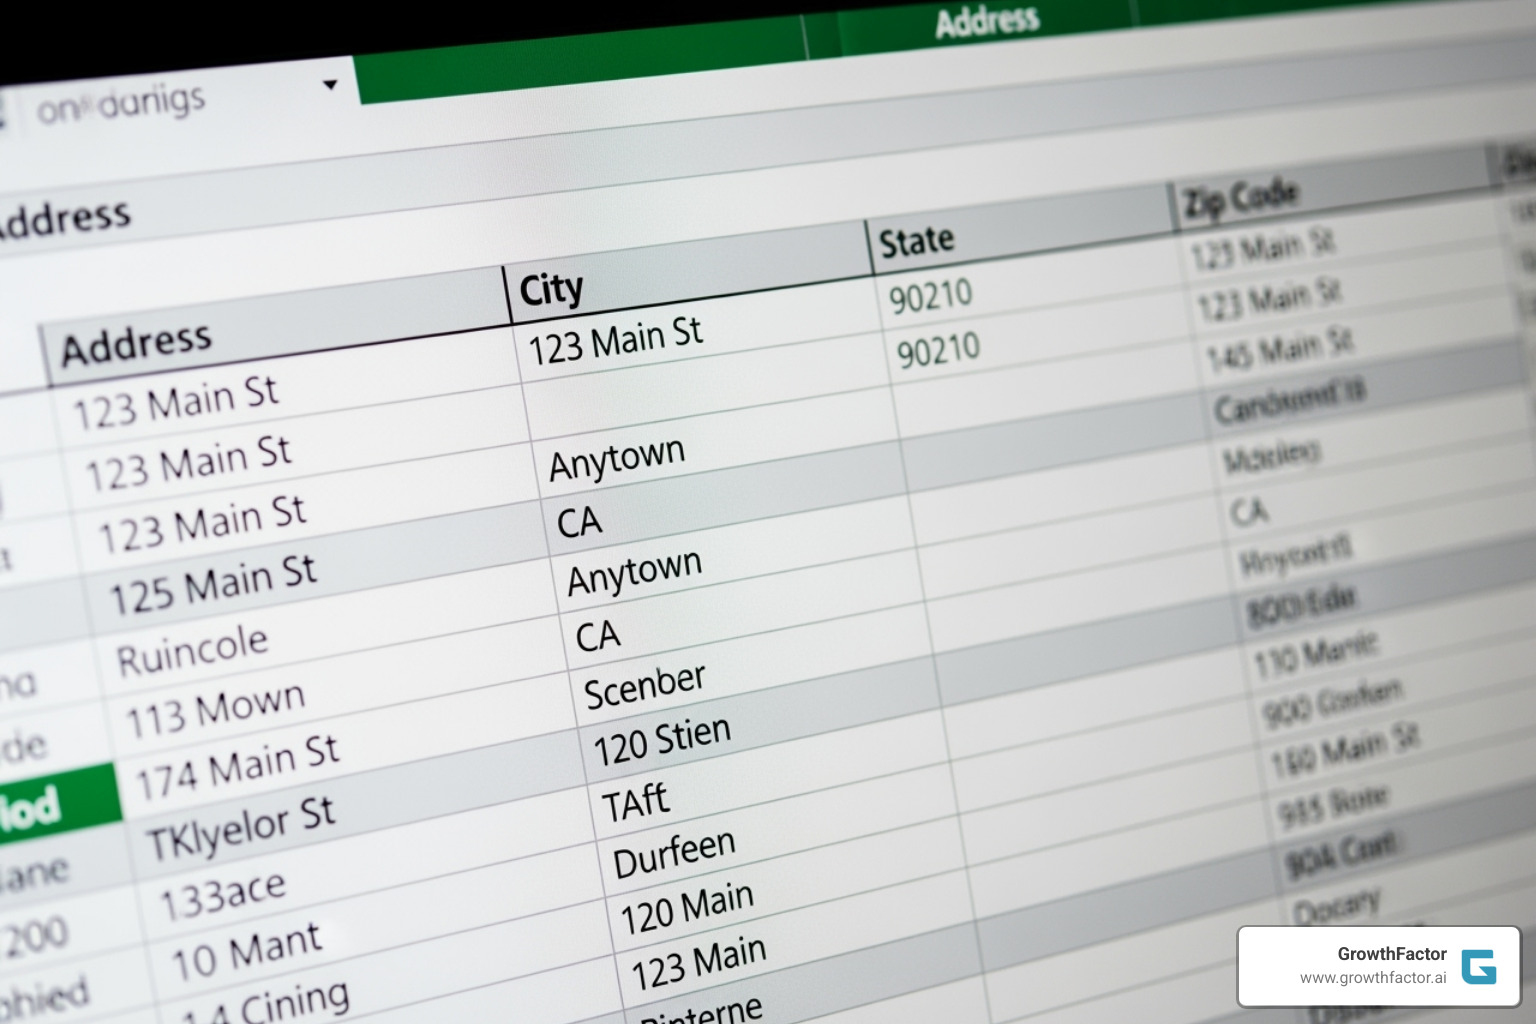
The quality of your map depends on your data. Before importing, ensure your spreadsheet is clean and well-structured.
- Location Data: Your file must contain location information. Google My Maps can interpret full street addresses, ZIP codes, or latitude and longitude coordinates.
- Business Data: Include columns that matter to your business, such as customer names, sales figures, territory assignments, or product categories. This data will be attached to each marker on your map.
- Data Cleaning: Spend a few minutes cleaning your data. Check for typos, missing information (like states in an address), and inconsistent formatting. Clean data prevents markers from being misplaced. For specifics, see Google's supported data formats guide.
Step-by-Step: How to create a territory map in Google Maps by importing data
- Import: In your My Maps project, click the "Import" button under the layer name.
- Select File: Drag and drop your CSV, XLSX, or Google Sheet, or browse your computer to select it.
- Choose Location Columns: Tell Google which column(s) contain your location data (e.g., "Address" or "ZIP Code").
- Choose Title Column: Select a column to use as the title for your map markers (e.g., "Customer Name").
- Finish: Click "Finish" to generate the map. Your data will appear as markers.
Always take a moment to verify a few data points to ensure they landed correctly on the map.
Customizing Your Map: Colors, Icons, and Layers
A map with identical pins is not very insightful. Customization turns raw data into visual intelligence.
- Base Map Style: Switch between the default roadmap, satellite, or terrain views to get different perspectives on your territories.
- Style by Data Column: Instead of uniform markers, color-code them or assign different icons based on a column in your data. For example, you could color-code customers by sales value or use different icons for different product categories.
- Custom Icons: You can add custom icons, such as your company logo for your stores.
- Layer Management: Each imported dataset exists on its own layer. You can toggle layers on and off to analyze different aspects of your market. For example, view "Existing Customers" and "Prospect Territories" separately or together to see current coverage versus expansion opportunities.
Beyond the Basics: Advanced Territory Analysis and Sharing
Once you know how to create a territory map in Google Maps, you can turn it into a strategic asset. A well-planned map is a living document that can guide business strategy, reveal opportunities, and align your team.
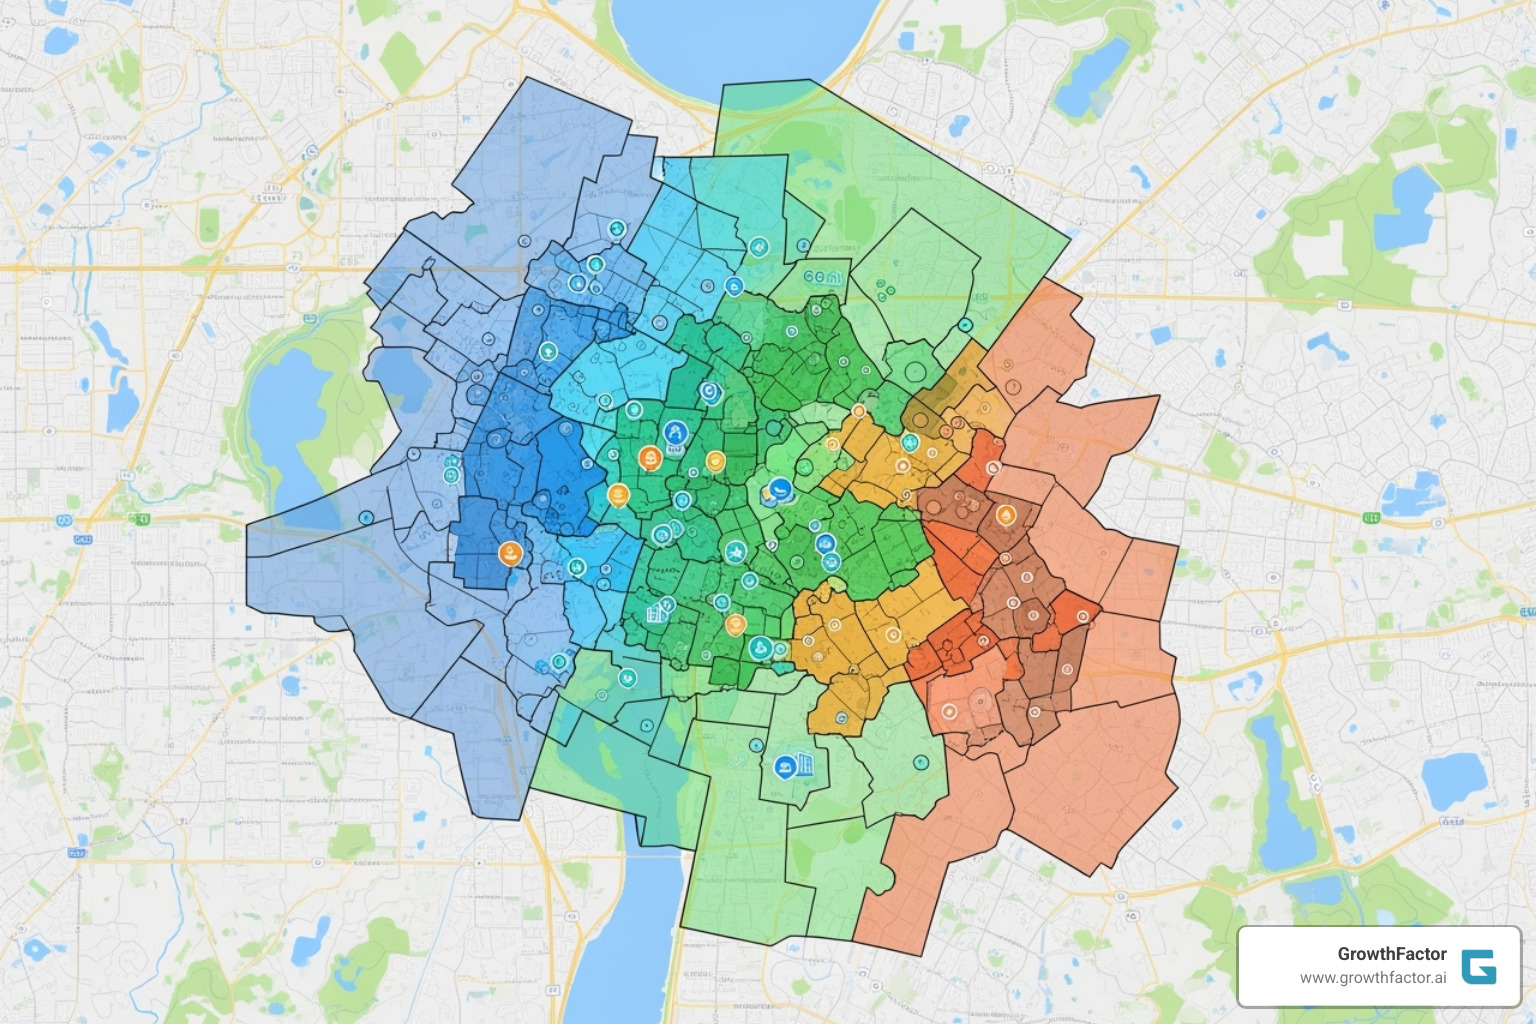
Strategic Considerations for Territory Mapping
A great territory map goes beyond simple geography. Consider these factors for effective planning:
- Workload Balancing: Account for the number of customers, sales potential, and travel time in each territory to ensure an equitable distribution of work among reps.
- Sales Potential: Aim for territories with roughly equivalent revenue opportunities. This requires understanding Trade Area dynamics, not just customer counts.
- Travel Time: Design territories to minimize driving time by grouping geographically close accounts.
- Geographic Barriers: Be mindful of real-world obstacles like rivers, mountains, and highways that can significantly impact travel.
- Market Dynamics: Markets evolve. A Data-Driven Site Selection approach recognizes that maps need regular adjustments as demographics and competition change.
Using Your Map for Sales Analysis
Your map is a powerful analytical tool that reveals patterns spreadsheets hide.
- Visualize Sales Density: Color-code territories or customers by sales volume to instantly spot high-performing and underperforming areas.
- Identify Market Gaps: See geographic areas with strong demographics but few customers, highlighting potential "white space" for expansion.
- Filter Data by Layer: Toggle layers for "High-Value Customers," "Prospects," or "Competitor Locations" to perform targeted analysis.
- Optimize Route Planning: Visually plan sales routes to minimize travel time and increase efficiency.
- Track Performance: Overlay target data with actual results to see which territories are meeting goals and which need support.
Sharing, Exporting, and Collaborating on Your Map
A map's true power is realized when it's shared. Use the "Share" button in Google My Maps to control access. You can make maps public, share them with anyone who has the link, or restrict access to specific people. For team collaboration, share the map with a Google Group to automate access for new and departing members.
You can also embed maps on internal websites for easy access or export them as KML/KMZ files. These files can be used in other applications for 3D visualization, providing a bridge between different mapping systems. As your needs grow, having exportable data makes transitioning to a more advanced Market Evaluation platform much smoother.
Google My Maps vs. Dedicated Mapping Software
While Google My Maps is an excellent starting point for learning how to create a territory map in Google Maps, it's crucial to understand its limitations as your business scales.
Google My Maps is ideal for basic visualization and small datasets. It handles up to 2,000 rows per layer with a maximum of 10 layers. In contrast, dedicated location intelligence platforms can manage millions of data points and offer advanced analytics that My Maps lacks. Where My Maps allows you to see your data, dedicated platforms help you understand it through spatial analysis, demographic overlays, and heat maps.
Automation is another key difference. My Maps is a manual tool. Dedicated software automates tasks like territory balancing and route optimization, saving significant time and improving efficiency. Finally, My Maps is free, while dedicated platforms are subscription-based. The choice depends on your current needs and growth trajectory.
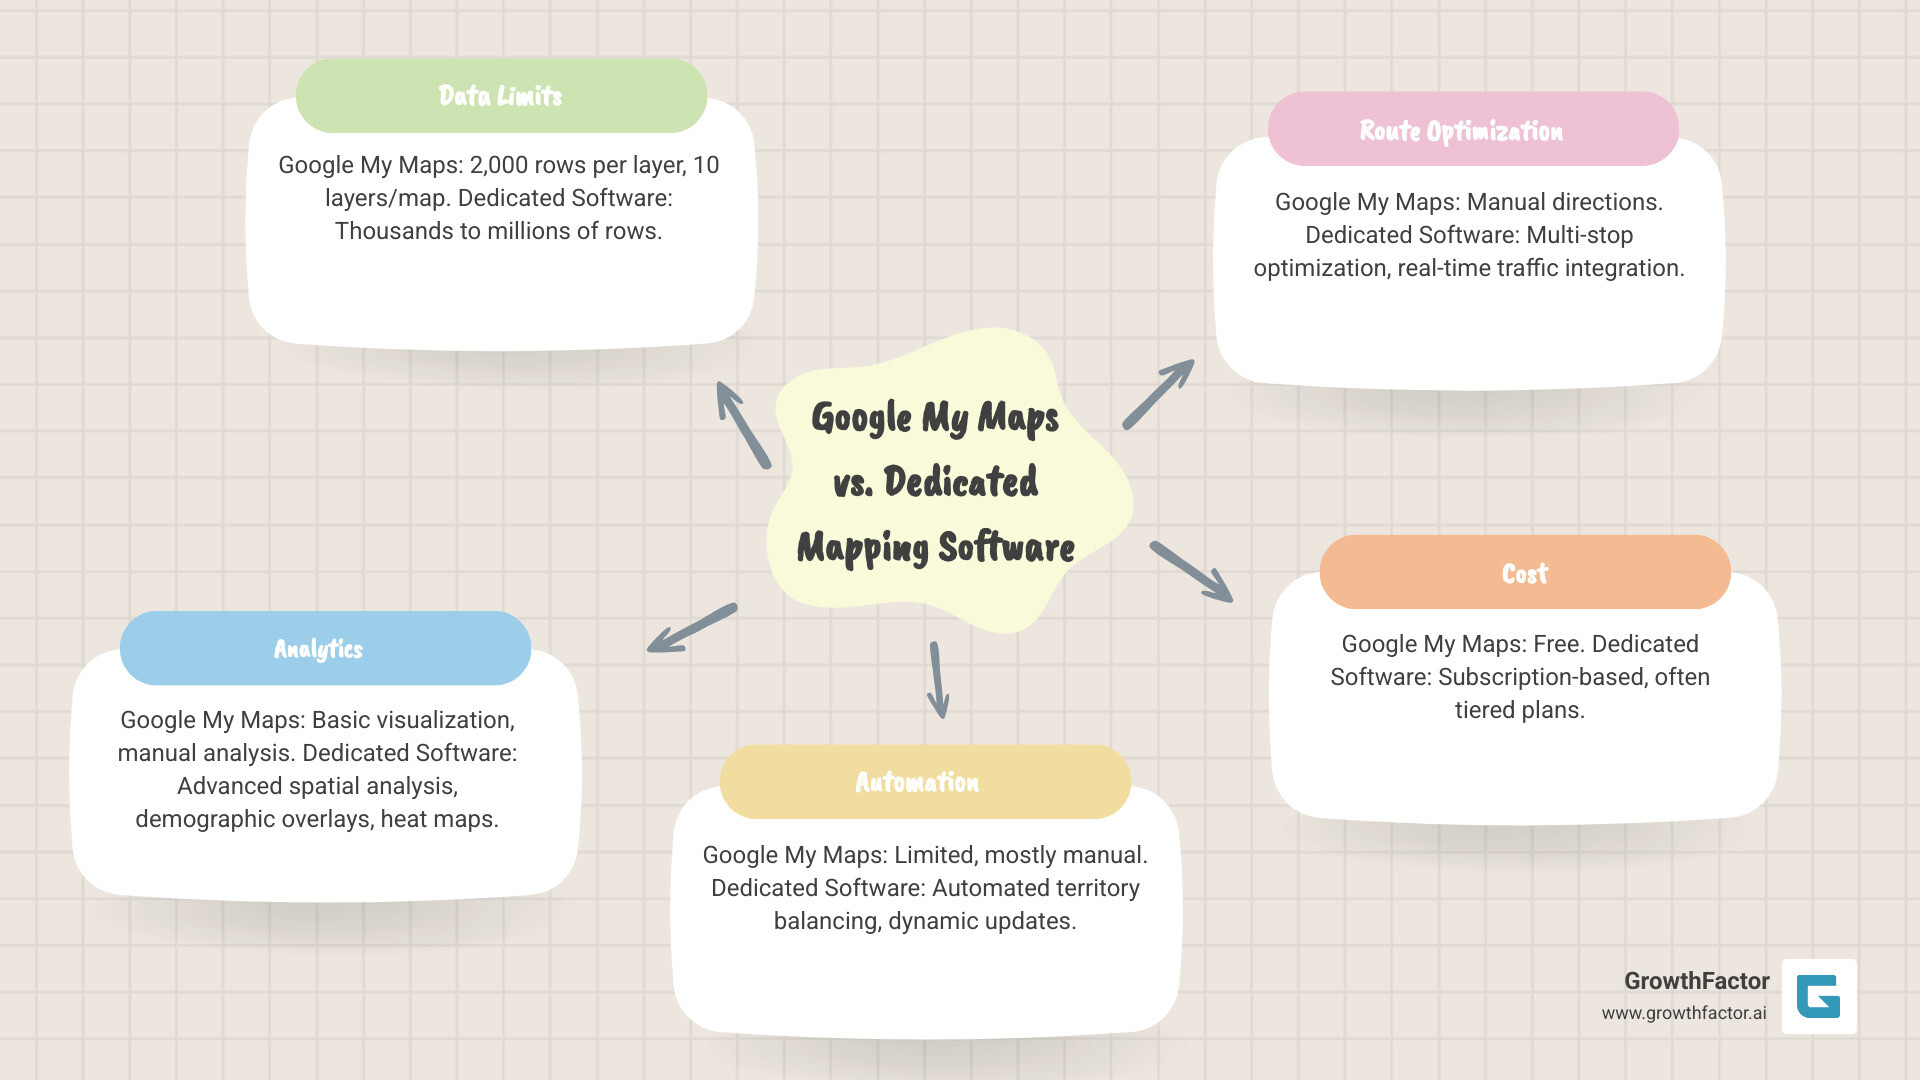
The Pros and Cons of Using Google My Maps
Advantages:
- Free to Use: No financial barrier to entry, perfect for testing mapping strategies.
- Simple Interface: Easy for anyone on your team to learn and use without technical training.
- Basic Visualization: Excellent for mapping customer locations, drawing sales regions, and sharing simple maps.
Disadvantages:
- Data Limitations: The 2,000-row and 10-layer limits are quickly reached by growing businesses.
- Manual Processes: Drawing and adjusting territories is time-consuming at scale.
- Limited Analytics: Lacks tools for deep analysis, such as identifying growth potential or underserved markets.
- No Demographic Data: You cannot overlay crucial data like household income, population density, or consumer spending.
When to Upgrade to a Location Intelligence Platform
It's time to upgrade when your business complexity demands more than basic visualization. Key indicators include:
- Managing Large Datasets: Your customer records, prospect lists, or site data exceed My Maps' capacity.
- Needing Advanced Analytics: You're asking complex questions about cannibalization risk, trade area potential, or market saturation that require sophisticated spatial analysis.
- Requiring Demographic Data: Your strategy depends on understanding the "who" behind the "where"—income levels, spending habits, and lifestyle preferences.
- Automating Territory Balancing: You need to optimize territories for dozens of reps based on workload, potential, and travel time.
- Integrating Multiple Data Sources: You need a single platform for Retail Site Selection Software that combines demographics, traffic, competition, and real estate data.
Modern platforms use AI-powered insights to surface opportunities and risks. At GrowthFactor, our platform helps retailers make faster, more confident decisions by identifying patterns in market data. For a deeper dive, see our Location Intelligence Platform Complete Guide.
Frequently Asked Questions about Creating Territory Maps
Here are answers to common questions about how to create a territory map in Google Maps.
Can I create territories based on a list of ZIP codes in Google My Maps?
Yes. First, import a spreadsheet with a column of ZIP codes. Google My Maps will place a marker at the center of each ZIP code. Then, use the polygon drawing tool to draw shapes that enclose your desired groups of ZIP code markers, effectively defining your territories. It's a manual but effective method for visualizing postal code-based regions.
Is Google My Maps completely free for territory mapping?
Yes, Google My Maps is 100% free to use. However, this comes with limitations, including a 2,000-row data limit per layer and a maximum of 10 layers per map. While perfect for basic mapping, these limits can be restrictive for large-scale operations, which often require a more robust location intelligence platform.
How do I measure the area or distance of a territory I've drawn?
Use the ruler icon in the toolbar. To measure distance, click the ruler, then click your start and end points on the map. To measure area, click the ruler and trace the perimeter of your polygon territory. My Maps will display the total area, which is useful for balancing territories and understanding market size.
Conclusion
You now know how to create a territory map in Google Maps, from manually drawing regions to importing customer data. Google My Maps is an excellent, free starting point for visualizing your business landscape, helping you see market patterns that spreadsheets hide.
As your retail chain grows, you'll begin asking deeper questions about demographic profiles, competitive impact, and true white space opportunities—questions that require more than basic mapping. This evolution from visualization to comprehensive market analysis is a sign of growth.
At GrowthFactor, we specialize in helping retailers make that leap. Our AI-improved Market Evaluation platform integrates demographic data, competitor intelligence, and predictive analytics to turn location data into actionable growth strategies.
Start with My Maps today to get comfortable with visual analysis. When you're ready for true location intelligence to drive your expansion, we're here to help you grow.
Citations
The human algorithm
Request Your demo
Schedule meeting
Or submit your information below and we'll be in touch to schedule.


