Have the site packet done before Thursday
Every site the brokers send, with the drive time, the demographics and your team's verdict, back in seconds.
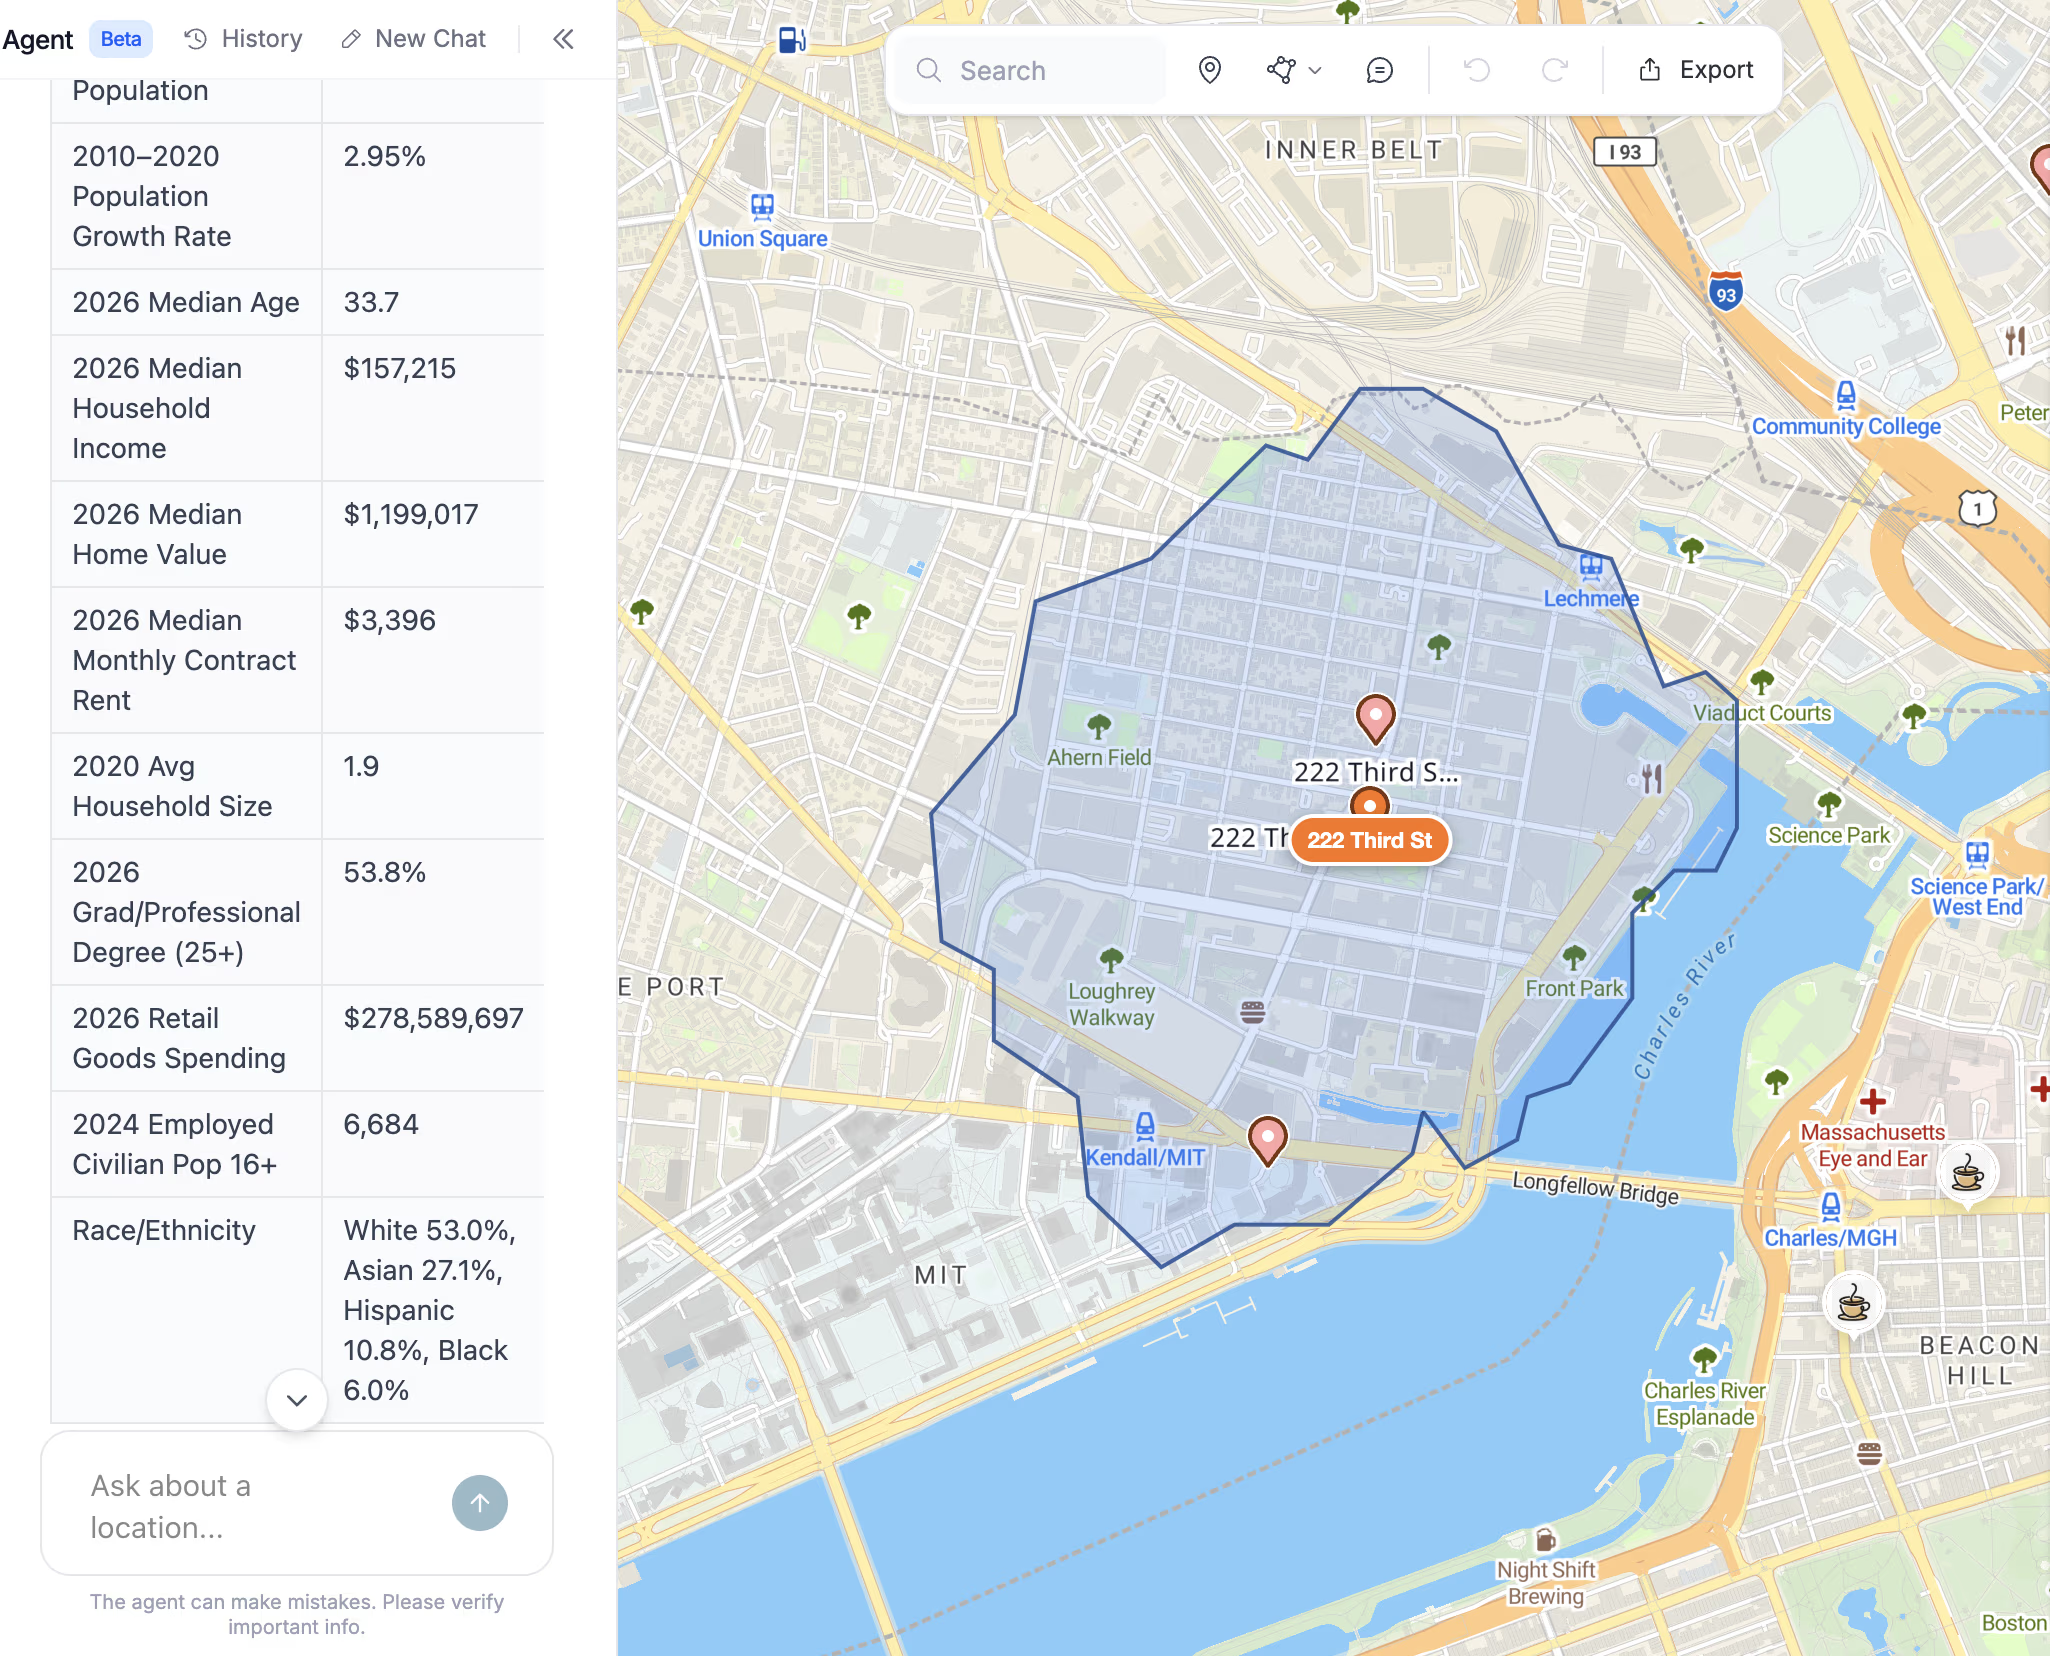
What the committee will ask
“Why this site and not the one on Route 9?”
Run your team's brief on both and read why one wins.
“Where's that income figure from?”
Every verdict names the data it used, so you can point at the source.
“What does it do to our store across town?”
Overlap with your existing stores is on the pin before anyone asks.
“Can you rerun it with the new rent?”
Rerun it in seconds. The PDF exports in seconds too.
Run the team's brief on all three
Ask for all three sites in plain English. Your brief runs on each one, and the answer says which leads and which data it trusted least.
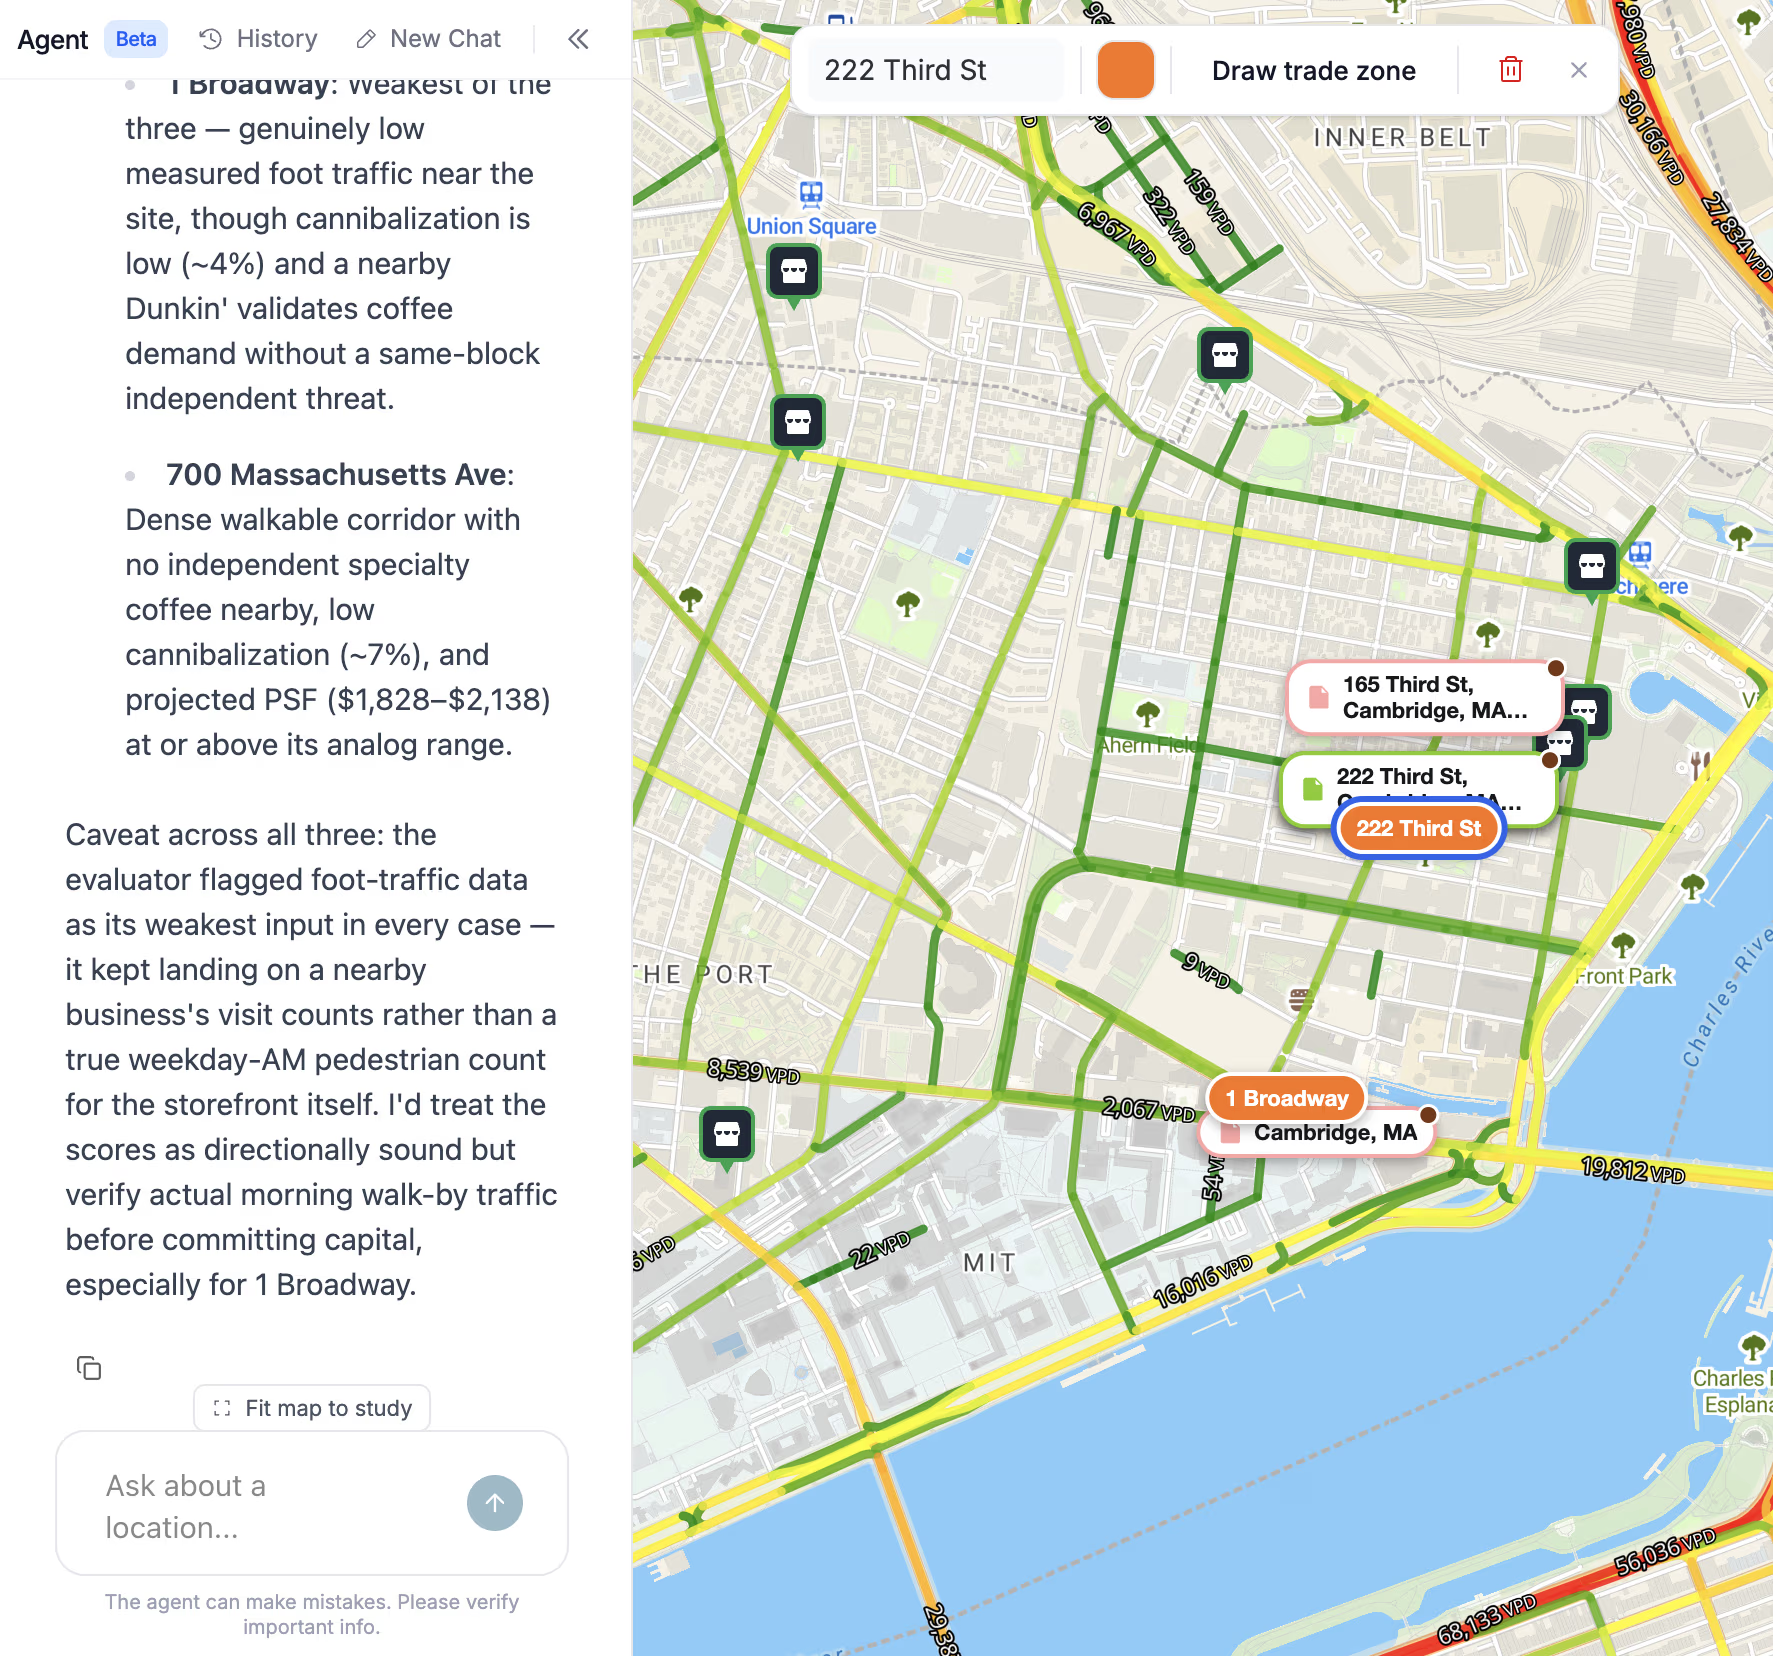
They bring the site. You bring the numbers back fast.
Brokers know the ground and the landlord. GrowthFactor answers the data part in about 10 seconds, so the call stays about the deal. Open listings sit on the same map.

Start where the question is
“Our business is very seasonal, and we have to manage evaluating hundreds of locations in a short time frame, while picking the best ones. GrowthFactor makes doing that simple.”
153
Locations TNT Fireworks opened in six months. Every one on time.
10x
The sites TNT Fireworks now takes through each committee cycle.
Bring the three sites on your desk
Live in a daySOC 2 compliantMIT Sloan Most Disruptive MBA Startup, 2025