AI Site Scoring
Scores you can explain to your board.
Every site scored 1–100. Every score broken into five lenses. Every lens justified in plain English. Walk into committee and defend any number—because you can see exactly where it came from.
The GrowthFactor Score
One number. Complete clarity.
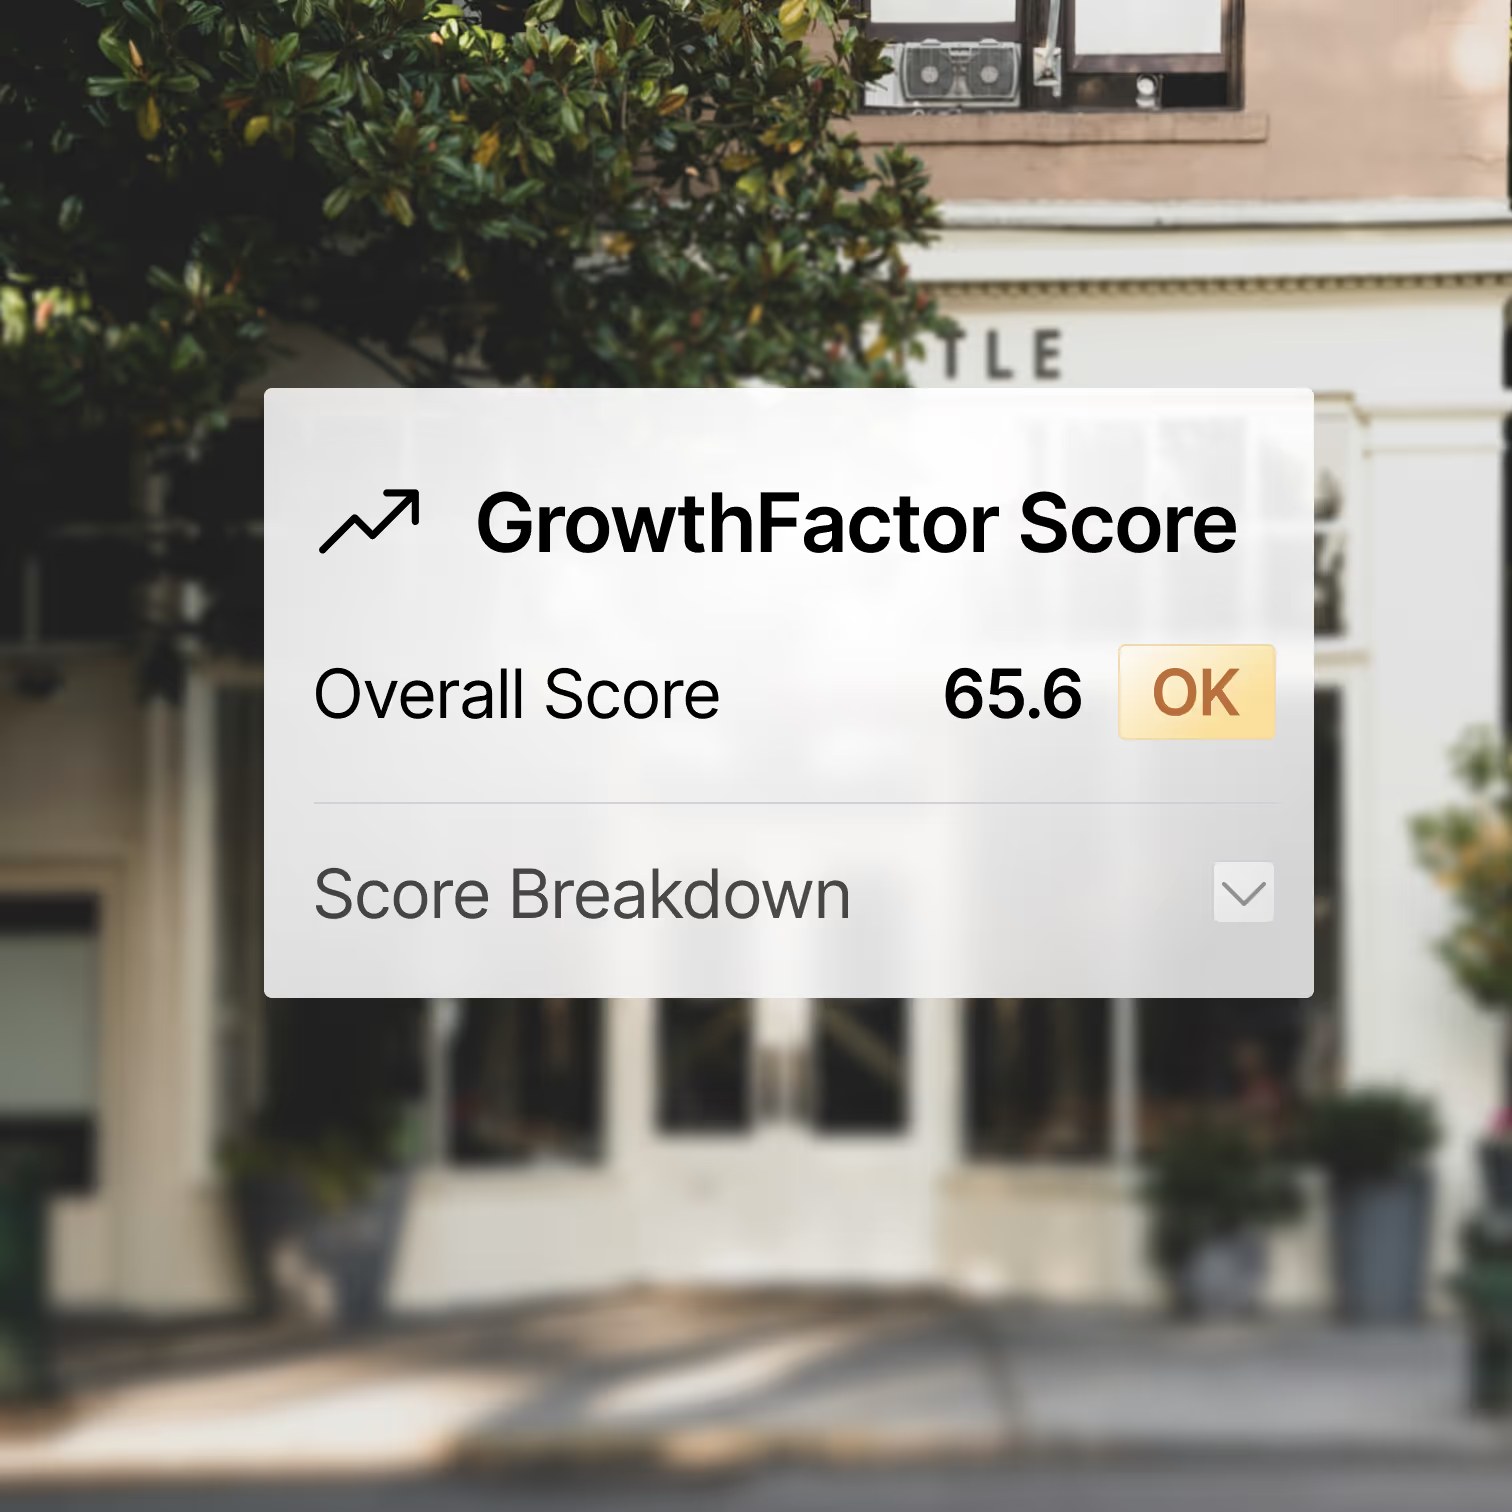
The GrowthFactor Score distills demographics, traffic, competition, visibility, and accessibility into a single 1–100 rating. At a glance, you know if a site is worth pursuing. But the number is just the start.
The Glass Box
See exactly what’s driving the score.
Every score breaks down into five lenses. Each lens gets its own score, grade, and a plain-English justification explaining the reasoning. No hidden weights. No “trust us.”
Demographics Fit
Population density, household income, age distribution, and education levels within the trade area—measured against what performs best for your brand.
"Manhattan’s high-income demographic is not the best fit for Blue Bronco’s value-oriented retail model."
Market Potential
Consumer spending patterns, foot traffic volume, population growth trajectory, and overall market opportunity in the surrounding area.
"Manhattan offers immense foot traffic and a diverse, high-volume consumer base for a clothing retailer."
Competition Analysis
Competitor density, market saturation, differentiation opportunity, and whether the trade area can support another entrant in your category.
"Manhattan has extremely high retail clothing competition, making differentiation and market penetration very challenging."
Visibility
Signage potential, street frontage, intersection prominence, foot traffic exposure, and brand awareness opportunity at the specific site.
"Manhattan 10036 has unparalleled foot traffic and prominent signage opportunities, maximizing brand exposure."
Accessibility
Vehicles per day on adjacent streets, parking adequacy, public transit access, ingress/egress quality, and ADA compliance.
"Multiple major transit hubs within walking distance, but limited dedicated parking may deter drive-in customers."
Custom Calibration
Built on your portfolio. Not a generic model.
We don’t score against industry averages. GrowthFactor finds your most similar existing stores—weighted by demographics, sales, and market conditions—and calibrates everything to what actually works for your brand.
For every site you search, the platform identifies up to five analog stores from your portfolio. Each analog is ranked by similarity. Revenue projections, score weights, and thresholds are derived from these real-world comparisons—not hypothetical benchmarks.
7601 S Cicero Ave, Chicago, IL
Similarity: 91.1%
2544 N Narragansett Ave, Chicago, IL
Similarity: 84.5%
49 W North Ave, Northlake, IL
Similarity: 83.8%
2099 N Mannheim Rd, Melrose Park, IL
Similarity: 83.5%
8560 E 49th Pl, Denver, CO
Similarity: 82.3%
Your Call
Disagree with the model? Good.
The best site decisions come from informed disagreement, not blind trust. You can adjust any weight, regenerate the score, and bring both versions to committee.
- Edit any lens weight to reflect your priorities
- Regenerate scores with adjusted parameters
- Compare original vs. modified side by side
- Add notes explaining your reasoning
- Share both versions with committee for discussion
Scores travel with every deal.
When a site moves from Searched to LOI to Signed Lease, its score, lenses, and justifications are right there. No copy-pasting. No “where did that number come from?”
5
Transparent scoring lenses
100%
Auditable—every score explained
Zero
Black box decisions

See how scoring works for your brand
We’ll score a real site for your portfolio and walk through every lens.