Chapter 01
General Real Estate Analysis Terms
Trade Zone
A trade zone (also known as a trade area) is the geographic area from which a retail site draws its customers. Defining this zone accurately is the foundation of site selection. It allows you to analyze key factors like the resident population, demographics, daytime population, potential demand, and competitive landscape.
The method you choose to define a trade zone is critical, as it directly impacts the quality of your analysis. A simple 1-mile circle might be easy to draw, but it fails to capture how people actually travel. Modern methods focus on the real-world factors that influence a customer's journey to a store.
Drive-Time Isochrones
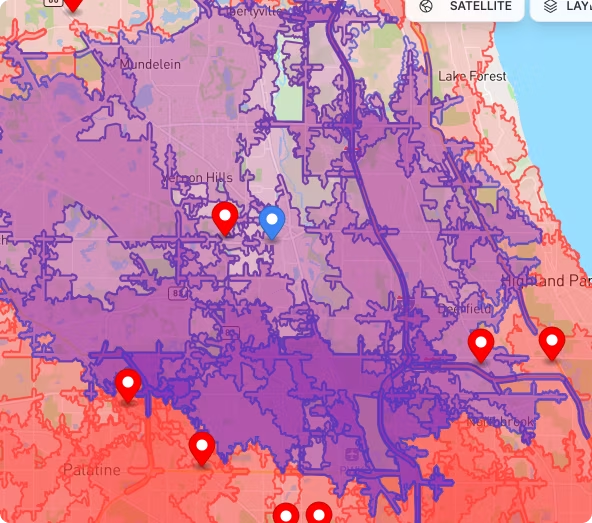
An isochrone is a line on a map connecting points of equal travel time from a central location. A drive-time isochrone creates a polygon that represents how far a vehicle can travel from a potential site in a given amount of time (e.g., 5, 10, and 15-minute drives).
Fig. 01
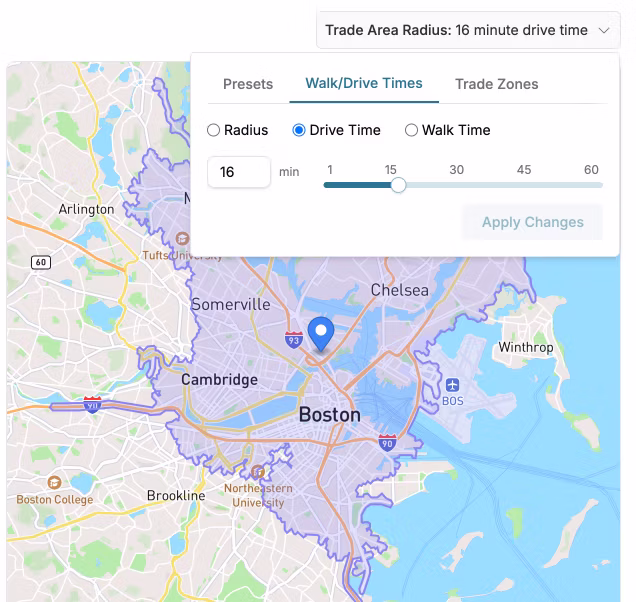
This method recognizes a fundamental truth of modern travel: people think in terms of time, not distance. A 3-mile drive can take 5 minutes on a highway but 20 minutes in congested city traffic. Drive-time analysis accounts for the actual road network, speed limits, turn restrictions, and typical traffic patterns.
When to use it:
- Suburban and Rural Locations: This is an effective method for areas where the automobile is the primary mode of transportation.
- Big-Box Retail, Grocery Stores, and Shopping Centers: For any destination that customers are expected to drive to, this provides the most realistic picture of the potential customer base.
- Logistics and "Last-Mile" Delivery: Essential for calculating delivery zones and ensuring service level agreements (SLAs) can be met.
Walk-Time Isochrones
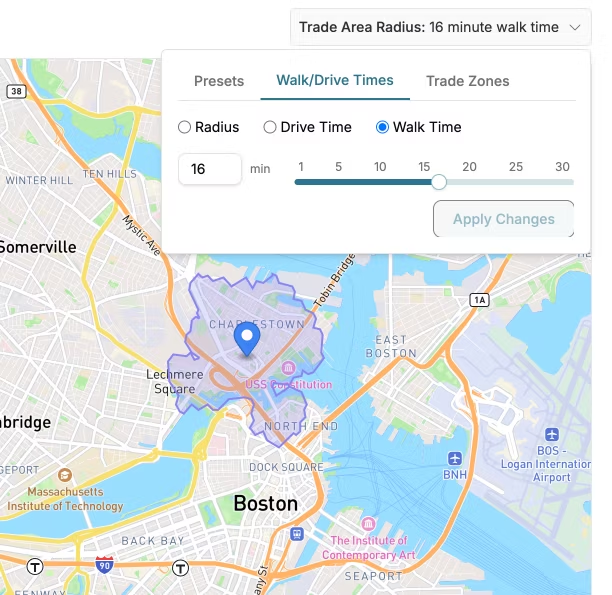
Similar to drive-time, a walk-time isochrone maps out how far a person can travel from a site by walking in a set amount of time (e.g., 5, 10, and 15-minute walks). This model accounts for the actual pedestrian network: sidewalks, crosswalks, pedestrian bridges, and parks, while respecting barriers like highways, rivers, and buildings.
Fig. 02
When to use it:
- Dense Urban Environments: Essential for cities like New York, Boston, or Chicago, where pedestrian activity is high.
- Central Business Districts (CBDs): Perfect for analyzing sites for coffee shops, fast-casual lunch restaurants, or convenience stores that rely on foot traffic from nearby office workers and residents.
- Transit-Oriented Developments (TODs): Ideal for understanding the walkable area around a train station or major bus stop.
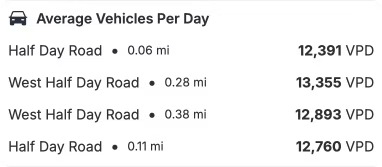
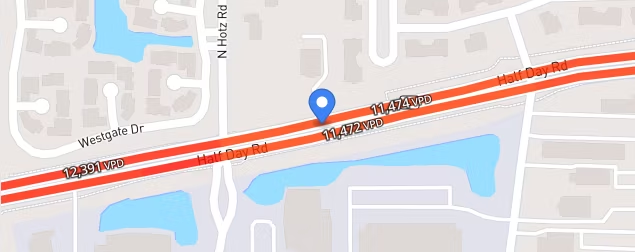
Customer Origination (Foot Traffic) Data
This method is the "ground truth" of customer behavior. It shows you the actual trade area based on where past visitors came from. This is typically sourced from anonymized and aggregated mobile device location data. By analyzing a site (or a competitor's site), you can generate a set of boundaries that contain the home or work locations of a certain percentage (e.g., 75% or 90%) of its observed visitors.
Fig. 03
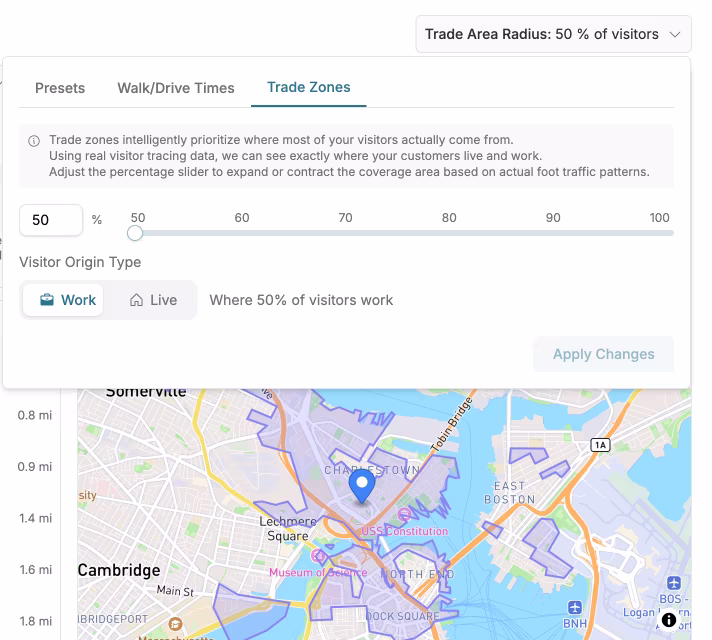
This approach inherently accounts for all modes of travel — walking, driving, and public transit — because it shows the final result of a customer's decision to visit.
When to use it:
- Analyzing Existing Stores: Perfect for understanding the performance of your own stores. Is a store underperforming because its trade area is smaller than expected?
- Competitive Analysis: Define a competitor's trade zone to understand their customer base, identify market gaps, and strategize on how to win market share.
- Validating Other Models: Use customer origination data to confirm or challenge the assumptions of a drive-time or walk-time model.
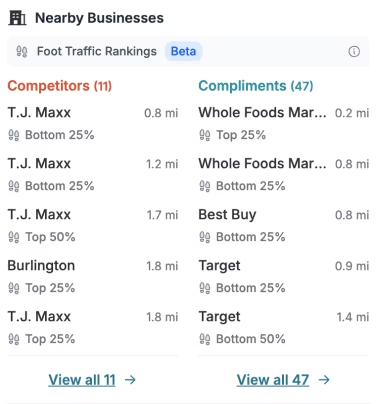
Competitors & Compliments
Once a trade zone is established, the next critical step is analyzing the existing retail landscape within that area. This analysis provides context for performance projections and strategic positioning by evaluating both competitive threats and synergistic opportunities.
Fig. 04
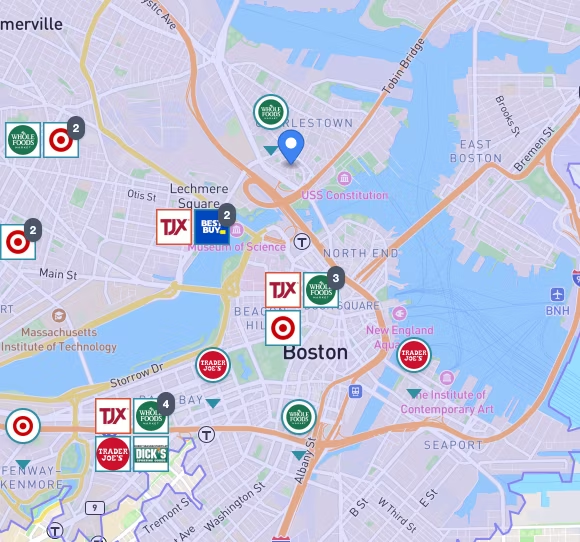
Fig. 05
Competitor Analysis
A competitor's presence is a source of critical market intelligence, not just another point on the map. The goal is to understand market saturation and identify strategic advantages.
- Mapping and Segmentation: Identify all direct and indirect competitors within the trade zone. Use foot traffic data to analyze their actual trade areas and performance, which can reveal underserved pockets or areas of intense competition.
- Cannibalization Risk: For chains, modeling the trade zone overlap between a proposed site and existing locations is essential to forecast potential sales transfer (cannibalization) and ensure net growth for the brand.
- Performance Benchmarking: A competitor's performance within the same trade zone serves as a real-world benchmark for the market's potential, helping to validate sales forecasts.
Leveraging Complementary Businesses
Complementary businesses attract a similar customer demographic without directly competing, creating a symbiotic relationship that can significantly boost traffic and sales.
Fig. 06
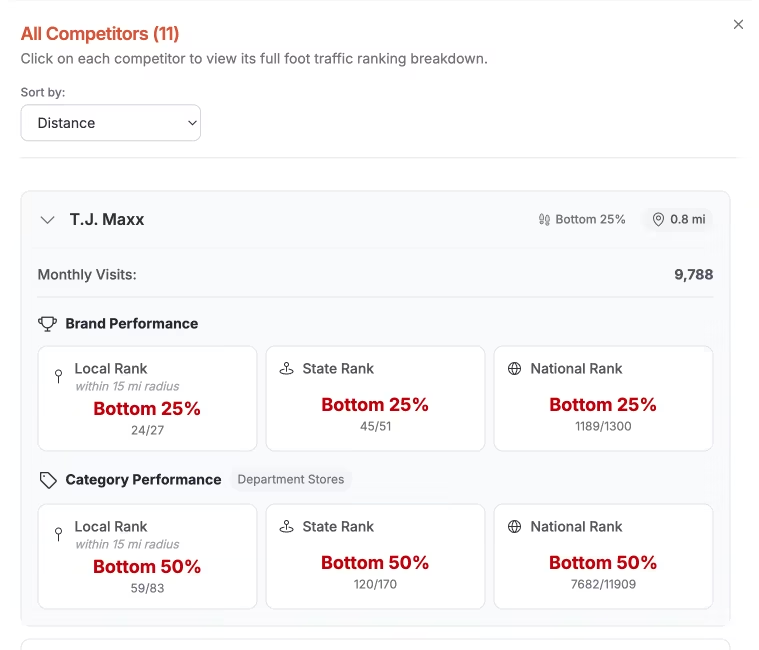
Fig. 07
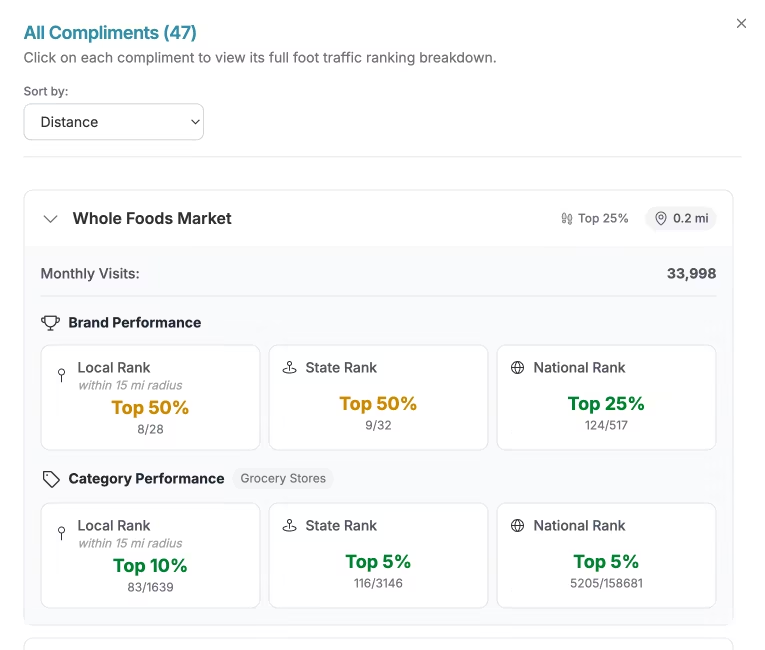
- Identifying Traffic Generators: Locate anchor tenants and high-frequency destinations (e.g., grocery stores, gyms, cinemas) that act as major traffic drivers. Proximity to these businesses can capture significant ancillary visits.
- Trip Chaining: Consumers often group errands into a single outing. Positioning a site near businesses that fit into a customer's typical routine increases visibility and convenience.
- Demographic Alignment: The strength of a co-tenant lies in its customer profile. Strong synergy exists when neighboring businesses appeal to the same target demographic, creating a compelling destination for that consumer group.
Analog-Based Sales Forecasting
Analog-based sales forecasting is a foundational methodology for projecting the performance of a proposed retail site by leveraging the performance of existing, comparable stores. The core principle is that a new site will perform similarly to existing stores that share its most critical trade area and site-specific characteristics.
Fig. 08
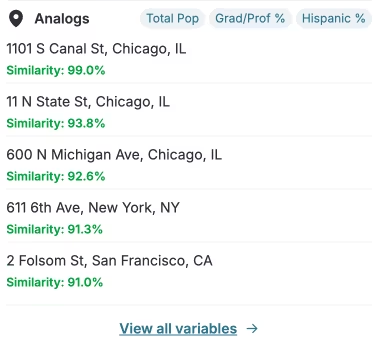
Fig. 09
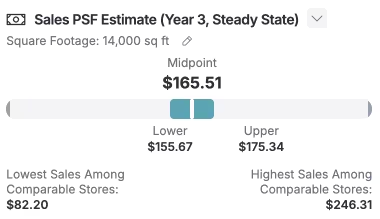
Fig. 10
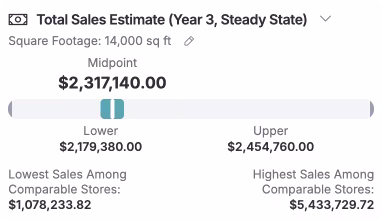
Fig. 11
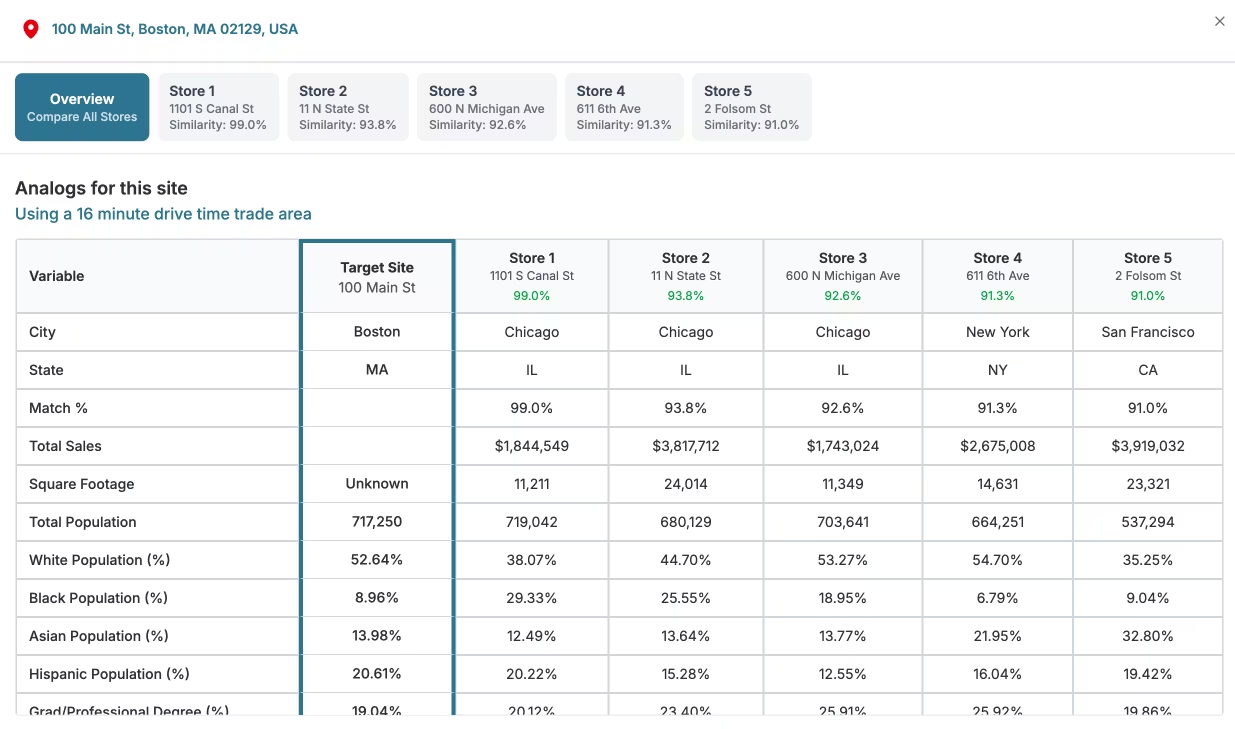
The process involves:
- Profiling the Proposed Site: A comprehensive profile of the potential new location is created, including trade zone demographics, competitive landscape, visibility, access, and co-tenancy.
- Identifying Analogs: The entire portfolio of existing stores is queried to find the locations that most closely match the proposed site's profile. These selected stores are the "analogs."
- Weighted Performance Analysis: The sales performance of analogous stores forms the basis of the forecast. A sophisticated model assigns a weight to each based on its degree of similarity. The closest analogs receive the highest weighting.
By calculating a weighted average of the analogs' performance, the model generates a reliable, data-driven sales forecast for the new location. The strength of this methodology lies in its empirical foundation — it is grounded in the actual, real-world performance of your own stores in similar environments, making it one of the most trusted approaches in site selection.
Sales Cannibalization
Sales cannibalization is a critical consideration in network expansion strategy. It occurs when a newly opened store captures sales from a nearby existing store owned by the same company, rather than generating purely incremental revenue.
Fig. 12
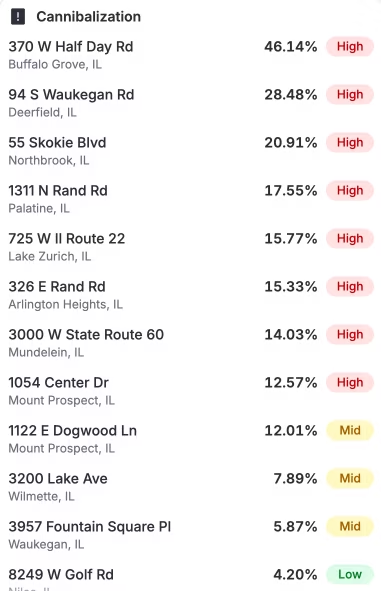
Fig. 13
The primary driver of cannibalization is the degree of trade zone overlap. When a new site's trade area significantly intersects with an existing store's, customers who previously patronized the older location may shift their business to the new one due to convenience, novelty, or proximity.
While some level of cannibalization is often unavoidable and can be strategically acceptable to defend a market or block a competitor, excessive overlap can be detrimental. A successful site selection model must accurately forecast the potential sales transfer to ensure that the new location will contribute positive net sales to the company's overall portfolio, rather than simply redistributing existing revenue.