Mapping Magic: Your Guide to Territory Maps in Excel
Written by: Clyde Christian Anderson
Why Territory Maps Matter for Growing Businesses

Retail executives and sales leaders often ask how to create a territory map in excel to visualize geographic data without expensive software. Here's the quick answer:
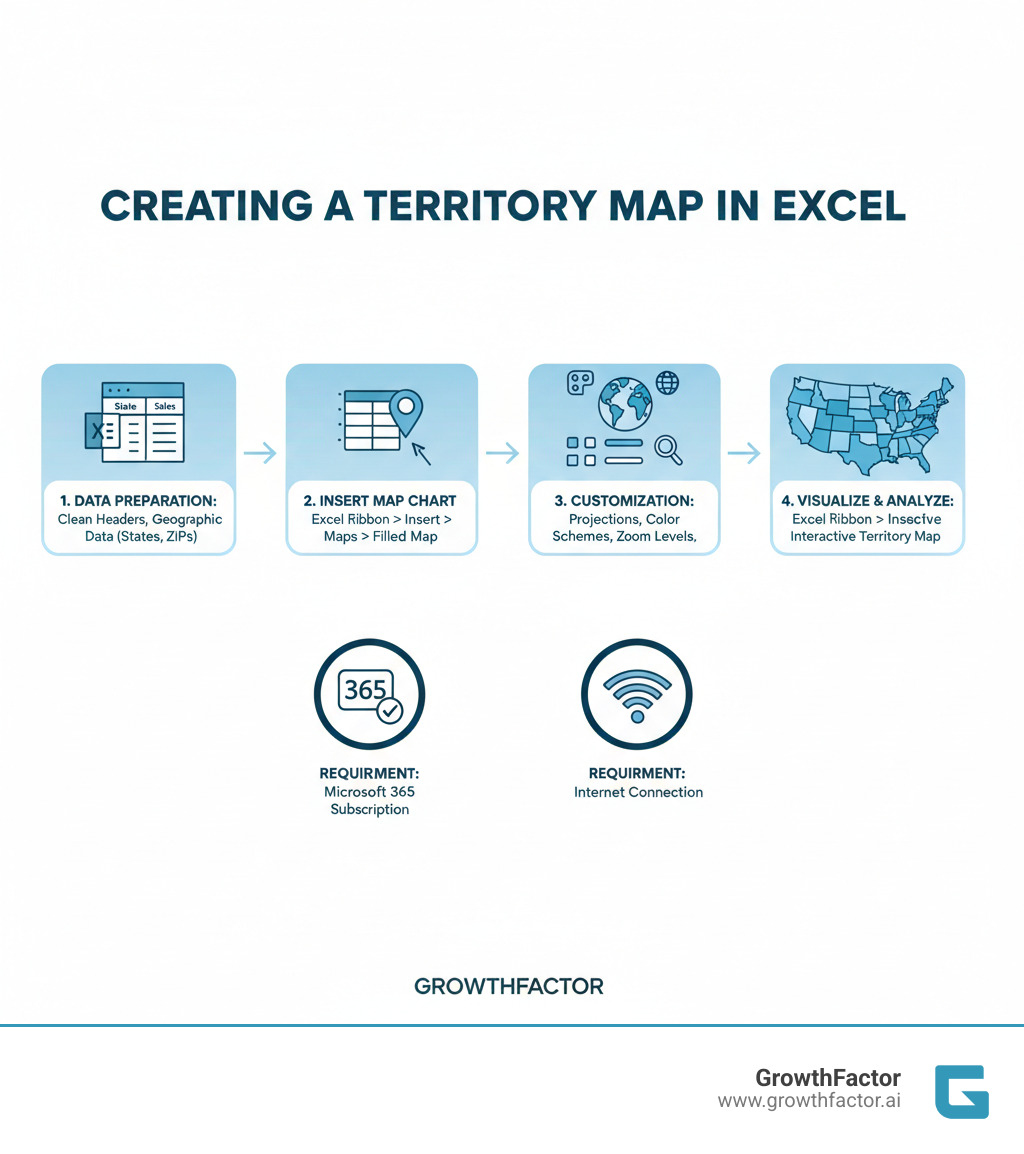
Quick Steps to Create a Territory Map in Excel:
- Prepare your data - Format your spreadsheet with clean headers and one location per row (ZIP codes, states, counties, or cities).
- Select your data range - Highlight the cells containing geographic information and associated values.
- Insert a Map Chart - Go to Insert > Maps > Filled Map in Excel (requires Microsoft 365 subscription).
- Customize your map - Adjust colors, projections, zoom levels, and labels using the Format Chart Area pane.
What You'll Need:
- Microsoft 365 subscription with Excel 2016 or later
- Active internet connection (connects to Bing Maps service)
- Geographic data (states, ZIP codes, counties, or country names)
A territory map visualizes geographic areas of responsibility, changing spreadsheet data into insights. It helps you see patterns you'd miss in a table, such as underperforming regions, territory overlaps, or untapped markets.
For retail chains, territory mapping is essential for evaluating expansion opportunities. As our client Mike Cavender of Cavender's Western Wear noted, companies often struggle with "black-box models that are hard to trust." Territory maps bring transparency to these decisions.
Excel's built-in mapping offers a starting point for basic visualization, like color-coding states by sales or highlighting ZIP codes by territory. The process is quick with properly formatted data.
However, Excel has limitations. It can't map street addresses or lat/long coordinates, struggles with large datasets, and won't perform advanced analysis like drive-time calculations. For growing retailers, these limitations become bottlenecks.
I'm Clyde Christian Anderson, founder of GrowthFactor. With over a decade in retail real estate, I've learned the power and limits of Excel for territory mapping. This guide will show you what Excel can do and when you need a more powerful solution.

Getting Started: Data Preparation and Foundations
The quality of your map depends entirely on the quality of your data. Messy data leads to worthless insights. When learning how to create a territory map in Excel, think of data preparation as the most critical step. A well-structured table with clean geographic data is essential for success.

Geographic Data Types for Territories
Excel's mapping features recognize several geographic data types:
- ZIP codes for detailed local territories.
- Counties for regional analysis.
- States for broad overviews.
- City names are usable but require context (like a state column) to avoid ambiguity.
- Country names and codes work for international maps.
- While Excel can store latitude and longitude coordinates, its Map Charts cannot plot them as points.
- Metropolitan Statistical Areas (MSAs) can also be mapped if formatted correctly.
Preparing Your Data: The First Step in How to Create a Territory Map in Excel
This prep work saves hours of frustration. First, ensure clean data. Standardize entries (e.g., use "CA" consistently, not "California" or "Calif."). Second, use a clear header row with descriptive names like "State" or "Sales Volume." Third, follow the one location per row rule; each row must represent a single geographic entity and its associated data.
Disambiguation is critical. For city names that exist in multiple states (e.g., "Springfield"), add a higher-level detail column like "State" or "Country" to provide context and prevent errors. This practice is fundamental to sophisticated Data Driven Site Selection strategies.
Finally, use Excel's Geography Data Types feature. Highlight a column of locations (like states or cities), go to the "Data" tab, and click "Geography." This converts the text into rich data objects, allowing you to pull in additional demographic information like population or area, enriching your map with new insights.
A few minutes spent on data prep will save hours of troubleshooting.
How to Create a Territory Map in Excel: The Built-in Method
With your data prepared, creating a territory map in Excel is straightforward. The built-in Map Charts feature, powered by Bing Maps, visualizes your geographic data in just a few clicks.

System and Data Requirements
Before you start how to create a territory map in excel, ensure you meet the system requirements:
- Microsoft 365 subscription: Map charts are a premium feature included with Excel 2016 or later through a Microsoft 365 subscription. Learn more about Microsoft 365 subscription benefits.
- Active internet connection: Excel uses the Bing Maps service to render maps, so you must be online.
- High-level geographic data: Map charts work with countries, states, counties, and ZIP codes, but not with specific street addresses or latitude/longitude coordinates. For more details, see Microsoft's support page on creating Map Charts.
Step-by-Step: Creating Your First Map Chart
The process is simple:
- Select your data range, including the headers for your geographic information and associated values.
- Go to the Insert tab, find the Charts group, and click Maps > Filled Map.
Excel will process your data and generate the map, automatically creating either a value chart or a category chart.
- Value Chart: If your data is numerical (e.g., sales figures), Excel uses a color gradient to show high and low values.
- Category Chart: If your data is categorical (e.g., territory names), Excel assigns a distinct color to each category.
If your map is blank or has errors, check for these common issues:
- Ambiguous data: A location like "Paris" needs a "Country" column to clarify whether it's in France or Texas.
- Spelling errors or inconsistencies: Ensure uniform formatting (e.g., "USA" vs. "United States").
- Unsupported data types: Excel can't map street addresses.
For working examples, download sample map chart workbooks from Microsoft. Understanding location data is crucial for broader analysis, as detailed in our Site Demographics Complete Guide.
Customizing and Analyzing Your Excel Map
Once you have a basic map, you can customize it to tell a more compelling story. Use the Chart Design tab and the Format Object Task Pane to turn raw data into actionable insights.

Customizing Your Map: How to Create a Territory Map in Excel That Tells a Story
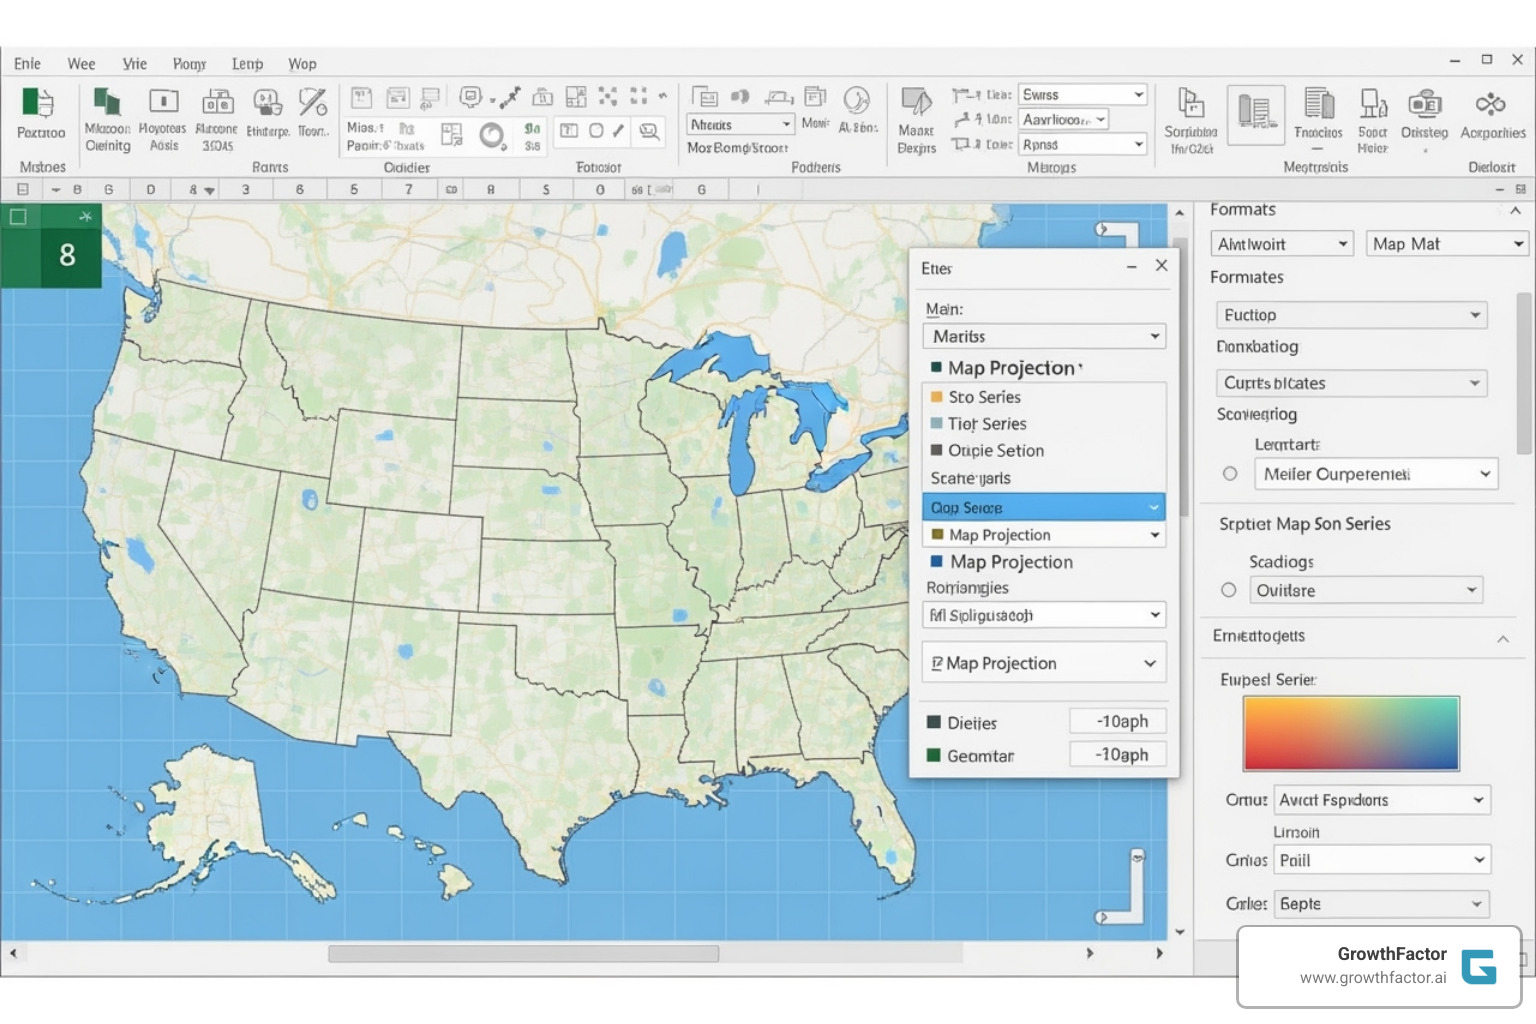
To begin, right-click the map and select 'Format Chart Area' to open the customization pane. Fine-tune your map's appearance and clarity with these options:
- Map projections: In the Series Options, choose a projection (e.g., Mercator, Albers) that best represents your data. Excel's default is usually sufficient.
- Map area: Control the zoom level to focus on a specific country or zoom out to a world view. This is useful for defining a Trade Area without visual clutter.
- Map labels: Add geographic names to your regions. Choose "Best fit only" to avoid overlapping text.
- Series colors: For numerical data, use a sequential (2-color) gradient for low-to-high values or a diverging (3-color) scheme to show deviation from a midpoint. For categorical data, assign unique colors to each territory for clear visual separation.
Gaining Insights: Analyzing Data Within Your Territories
A customized map is a powerful analytical tool for revealing patterns hidden in spreadsheets. Use your map to gain business insights:
- Identify trends: Quickly see regional patterns, like weaker sales in one area or unexpected growth in another.
- Spot outliers: A single high-performing territory among average ones stands out visually, prompting investigation into what's working.
- Analyze performance: Combine your map with other charts (e.g., bar charts of sales volume) for a multi-dimensional view. This is key to an effective Foot Traffic Analysis Complete Guide.
- Guide resource allocation: Data-driven maps showing customer density or sales performance make it clear where to add staff or marketing spend. This is the foundation of smart Retail Location Analysis.
- Improve accountability: Clearly defined visual territories ensure sales reps and managers know their areas of responsibility.
Beyond the Spreadsheet: When to Use Specialized Mapping Software
Excel is a great starting point for territory mapping, but growing businesses often hit its limitations. For retail chains making high-stakes site selection decisions, relying solely on Excel can be costly and constraining, especially when evaluating many locations or complex territory overlaps.
| Feature / Capability | Excel's Built-in Map Charts | Specialized Location Intelligence Software |
|---|---|---|
| Geographic Detail | High-level (countries, states, counties, ZIP codes) | Granular (street addresses, lat/long, custom polygons) |
| Data Volume | Best for small to medium datasets | Handles massive datasets (thousands to millions of points) |
| Customization | Basic (colors, labels, projections, zoom) | Advanced (custom markers, logos, heat maps, clustering) |
| Analysis | Visual trends, basic value/category comparison | Multi-layer analysis, demographic overlays, drive-time, optimization |
| Territory Creation | Predefined administrative boundaries only | Free-form drawing, drive-time polygons, automated balancing |
| Connectivity | Online connection to Bing Maps for basic functions | Offline capabilities, integration with various data sources |
| Advanced Features | Limited (no routing, no spatial analysis) | Route optimization, site scoring, cannibalization analysis |
| Accessibility | Included with Microsoft 365 | Dedicated software, often subscription-based |
Common Limitations of Excel for Territory Mapping
Understanding Excel's limitations is key to knowing when to upgrade your tools for serious business decisions. Key limitations of Excel mapping include:
- No precise location plotting: Excel cannot map specific street addresses or latitude/longitude coordinates, a dealbreaker for plotting store or customer locations.
- Poor performance with large datasets: Spreadsheets slow down or crash when trying to map thousands of data points.
- Inability to create custom territories: You are limited to predefined boundaries like ZIP codes or counties and cannot create territories based on drive-time or custom shapes.
- Limited multi-layer analysis: Overlaying different datasets like demographics, sales, and competitor locations is difficult.
Many businesses find themselves in "End The Era Of Spreadsheet Purgatory: How AI Is Revolutionizing Retail Site Selection."
The Power of Dedicated Location Intelligence Platforms
Specialized location intelligence platforms offer a fundamental shift in capability. Dedicated platforms provide powerful features, such as:
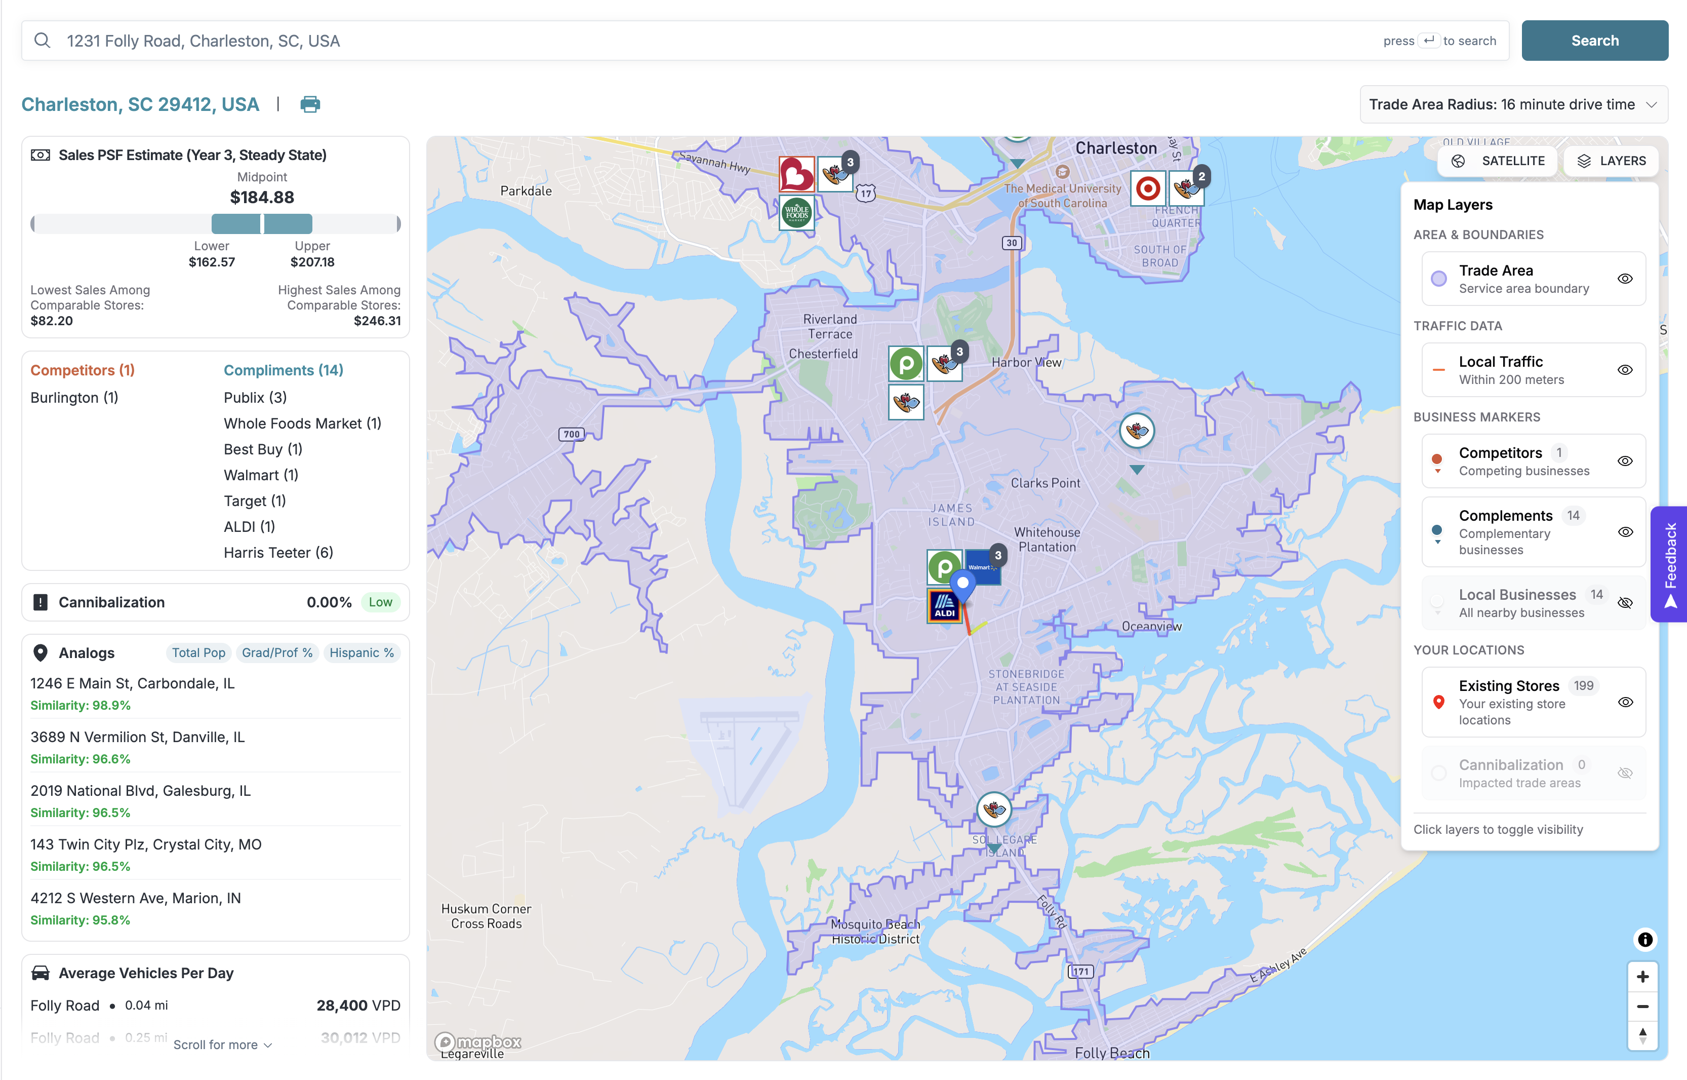
- Advanced analysis: Layer multiple data sources—demographics, traffic patterns, and Footfall Analytics—on a single map.
- Drive-time polygons: Define territories based on realistic travel times, optimizing routes and reducing costs.
- Heat maps and clustering: Instantly visualize customer density and sales hotspots without clutter.
- AI-powered insights: Leverage AI Location Intelligence to forecast sales for new sites and analyze cannibalization risk.
- Scalability: Handle millions of data points smoothly, a must for any serious Location Intelligence Software Complete Guide.
- Route optimization: Reduce fuel costs and increase efficiency for field teams.
While Excel is a valuable entry point for learning how to create a territory map in excel, specialized platforms are essential when mapping becomes central to high-stakes strategic decisions.
Frequently Asked Questions about Territory Mapping in Excel
Here are answers to common questions that arise when learning how to create a territory map in excel.
Why is my Excel map blank or showing an error?
A blank map or error message is usually caused by ambiguous location data. For example, Excel doesn't know if "Springfield" is in Illinois or Missouri without more context. The fix is to add a higher-level detail column, like "State" or "Country," to clarify the location. Also, check for typos and ensure consistent naming (e.g., use "CA" for all California entries).
Can I create a territory map using ZIP codes in Excel?
Yes, Excel handles ZIP code mapping well. Create one column for ZIP codes and another for associated data (like sales or territory names). Ensure both columns have headers. Select the data and choose Insert > Maps > Filled Map. Excel will color-code the ZIP code areas on the map, which is ideal for analyzing performance at a neighborhood level or dividing metropolitan areas for sales teams.
Does creating a territory map in Excel require an internet connection?
Yes, an active internet connection is required. Excel's Map Charts feature connects to the Bing Maps service to render your map. You need to be online to create new maps and to update data on existing ones. If presenting where internet may be unreliable, consider taking screenshots of your finalized maps as a backup.
Conclusion
We've covered how to create a territory map in excel, from data prep to final customization. Excel’s built-in mapping is a valuable, accessible tool for turning geographic data into a visual story of your business's performance.
The foundation is always clean, well-organized data. Proper structure allows you to spot patterns in minutes that would be lost in a spreadsheet.
Excel's Map Charts are ideal for basic analysis using states, counties, and ZIP codes. However, Excel hits its ceiling when you need to plot specific addresses, analyze drive-time, layer multiple datasets, or handle large amounts of data.
For growing businesses, a simple Excel map often reveals the need for deeper analysis and more sophisticated tools to answer complex questions about demographics or site accessibility.
At GrowthFactor, our AI-powered platform picks up where spreadsheets leave off. We provide predictive insights for Retail Site Selection Analysis, helping businesses make confident expansion decisions. Our clients use AI Driven Analytics to find opportunities hidden in the data.
Whether you use Excel or advanced location intelligence, the goal is to make smarter, data-informed decisions. Excel is a solid start. When you're ready for the next step, GrowthFactor is here to help.
Curious about what's possible beyond spreadsheets? Explore our Market Evaluation services to see how our tools provide true strategic intelligence for retail real estate decisions.
Citations
The human algorithm
Request Your demo
Schedule meeting
Or submit your information below and we'll be in touch to schedule.


